Decision Tree Analysis

The ConceptDraw DIAGRAM diagramming and drawing software is the one that can help with creating the needed drawing, including a decision tree. Making decision tree analysis, it is always easy to make the needed matrix as there are plenty of pre-made templates to be used.
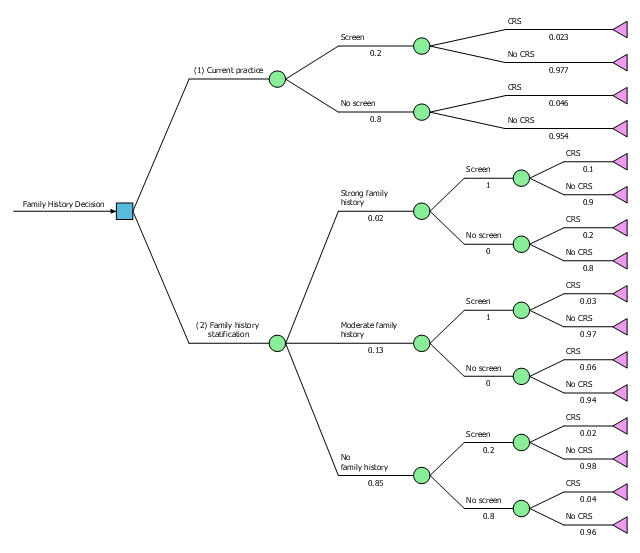
This example was designed on the base of Figure 4.33 "Decision Tree Comparing Colorectal Screening Current Practice with a Targeted Family History Strategy" from the "Principles of Epidemiology in Public Health Practice, Third Edition. An Introduction to Applied Epidemiology and Biostatistics. Self-Study Course SS1978. Lesson 4: Displaying Public Health Data. Section 4: Other Data Displays" on the Centers for Disease Control and Prevention (CDC) website.
"The graph shows a decision tree with outcomes, and probabilities. In this case, a family history decision tree has 16 potential outcomes."
[cdc.gov/ ophss/ csels/ dsepd/ ss1978/ lesson4/ section4.html]
"A decision tree is a decision support tool that uses a tree-like graph or model of decisions and their possible consequences, including chance event outcomes, resource costs, and utility. It is one way to display an algorithm that only contains conditional control statements.
Decision trees are commonly used in operations research, specifically in decision analysis, to help identify a strategy most likely to reach a goal, but are also a popular tool in machine learning." [Decision tree. Wikipedia]
The diagram example "Decision tree" was designed using ConceptDraw software extended with Decision Making solution from Management area of ConceptDraw Solution Park.
Decision diagram example
This example was designed on the base of Wikimedia Commons file: Decision tree using flow chart symbols.jpg.
"This is a decision tree that is written using flow chart symbols."
[commons.wikimedia.org/ wiki/ File:Decision_ tree_ using_ flow_ chart_ symbols.jpg]
This file is licensed under the Creative Commons Attribution-Share Alike 3.0 Unported license. [creativecommons.org/ licenses/ by-sa/ 3.0/ deed.en]
"A decision tree is a flowchart-like structure in which each internal node represents a "test" on an attribute (e.g. whether a coin flip comes up heads or tails), each branch represents the outcome of the test, and each leaf node represents a class label (decision taken after computing all attributes). The paths from root to leaf represent classification rules." [Decision tree. Wikipedia]
The diagram example "Decision tree flowchart" was designed using ConceptDraw software extended with Decision Making solution from Management area of ConceptDraw Solution Park.
Decision diagram example
The vector stencil library "Decision tree" contains 10 decision tree diagram building blocks.
Use it to design your decision tree diagrams.
The diagram building blocks
example "Design elements - Decision tree" is included in Decision Making solution from Management area of ConceptDraw Solution Park.
Use it to design your decision tree diagrams.
The diagram building blocks
example "Design elements - Decision tree" is included in Decision Making solution from Management area of ConceptDraw Solution Park.
Decision diagram stencils
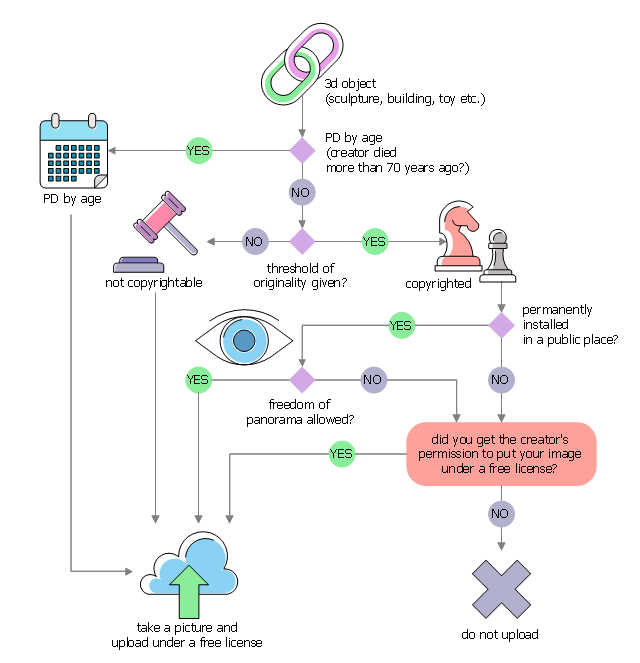
This example was designed on the base of the Wikimedia Commons file: Derivative Works Decision Tree.svg.
"Decision tree for authorization (or not) of derivative works on Commons"
[commons.wikimedia.org/ wiki/ File:Derivative_ Works_ Decision_ Tree.svg]
"Wikimedia Commons is a shared free image repository. Rather than uploading the same image to some 720 wikis individually, images can be uploaded to commons and can be used from every wiki. This both saves time and server resources." [Wikipedia:Commons Upload Campaign. Wikipedia]
The diagram example "Derivative works decision tree" was designed using ConceptDraw software extended with Decision Making solution from Management area of ConceptDraw Solution Park.
Decision diagram example
Fault Tree Diagram

 Fault Tree Analysis Diagrams
This solution extends ConceptDraw DIAGRAM.5 or later with templates, fault tree analysis example, samples and a library of vector design elements for drawing FTA diagrams (or negative analytical trees), cause and effect diagrams and fault tree diagrams.
, t chart, decision matrix, decision tree analysis") Decision Making
Decision Making
The Decision Making solution offers the set of professionally developed examples, powerful drawing tools and a wide range of libraries with specific ready-made vector decision icons, decision pictograms, decision flowchart elements, decision tree icons, decision signs arrows, and callouts, allowing the decision maker (even without drawing and design skills) to easily construct Decision diagrams, Business decision maps, Decision flowcharts, Decision trees, Decision matrix, T Chart, Influence diagrams, which are powerful in questions of decision making, holding decision tree analysis and Analytic Hierarchy Process (AHP), visual decomposition the decision problem into hierarchy of easily comprehensible sub-problems and solving them without any efforts.
 Family Tree
Family Tree solution with included vector design shapes for drawing family trees, pedigree chart symbols, photo blocks of different detailing and professionally designed samples, extends the functionality of ConceptDraw DIAGRAM software making it the best family tree maker and easy-to-use ancestry trees designer program for researchers, scientists, historians, genetics, medics, archeologists, and other stakeholders. Use it to design informative and colorful genealogy trees, simple family tree or extensive ancestry tree of any depth, genealogy schematics and illustrations with family trees.
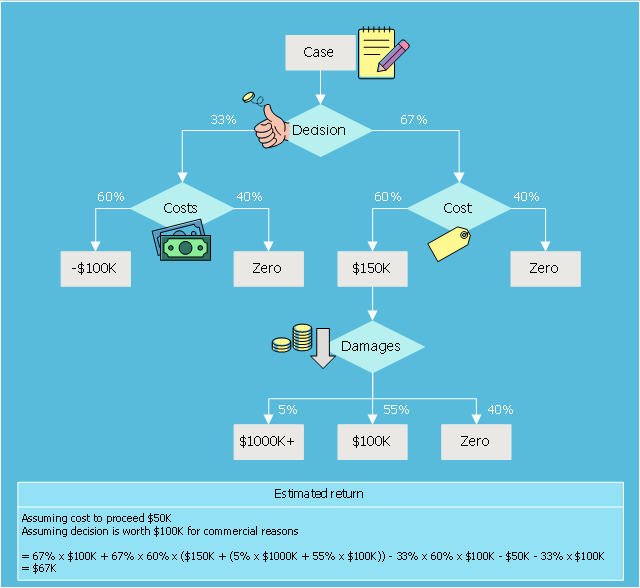
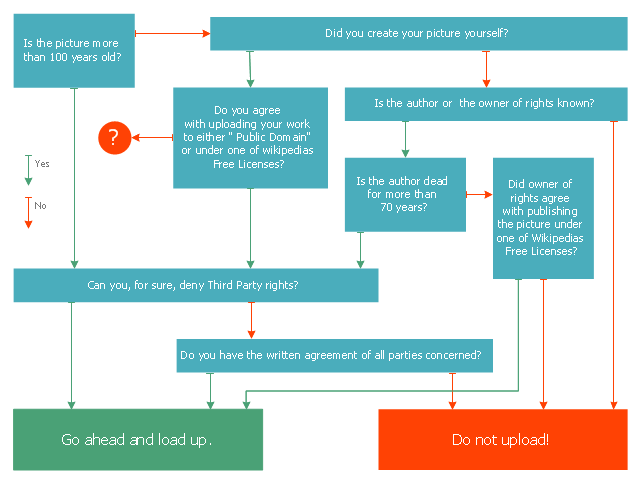
This marketing diagram sample represents decision tree. It was redesigned from the Wikimedia Commons file: Decision Tree on Uploading Imagesv2.svg.
[commons.wikimedia.org/ wiki/ File:Decision_ Tree_ on_ Uploading_ Imagesv2.svg]
"A decision tree is a decision support tool that uses a tree-like graph or model of decisions and their possible consequences, including chance event outcomes, resource costs, and utility. It is one way to display an algorithm.
Decision trees are commonly used in operations research, specifically in decision analysis, to help identify a strategy most likely to reach a goal. ...
A decision tree is a flowchart-like structure in which internal node represents test on an attribute, each branch represents outcome of test and each leaf node represents class label (decision taken after computing all attributes). A path from root to leaf represents classification rules.
In decision analysis a decision tree and the closely related influence diagram is used as a visual and analytical decision support tool, where the expected values (or expected utility) of competing alternatives are calculated.
A decision tree consists of 3 types of nodes:
(1) Decision nodes - commonly represented by squares.
(2) Chance nodes - represented by circles.
(3) End nodes - represented by triangles.
Decision trees are commonly used in operations research, specifically in decision analysis, to help identify a strategy most likely to reach a goal." [Decision tree. Wikipedia]
The marketing diagram example "Decision tree" was created using the ConceptDraw PRO diagramming and vector drawing software extended with the Marketing Diagrams solution from the Marketing area of ConceptDraw Solution Park.
Marketing flowchart
HelpDesk
How to Draw a Decision-Making Diagram

 Marketing Diagrams
Marketing Diagrams solution extends ConceptDraw DIAGRAM diagramming software with abundance of samples, templates and vector design elements intended for easy graphical visualization and drawing different types of Marketing diagrams and graphs, including Branding Strategies Diagram, Five Forces Model Diagram, Decision Tree Diagram, Puzzle Diagram, Step Diagram, Process Chart, Strategy Map, Funnel Diagram, Value Chain Diagram, Ladder of Customer Loyalty Diagram, Leaky Bucket Diagram, Promotional Mix Diagram, Service-Goods Continuum Diagram, Six Markets Model Diagram, Sources of Customer Satisfaction Diagram, etc. Analyze effectively the marketing activity of your company and apply the optimal marketing methods with ConceptDraw DIAGRAM software.
Decision Making


Influence Diagram

HelpDesk
How to Draw a Family Tree

Fault Tree Analysis Example

Marketing Charts

Fault Tree Analysis Software

The vector stencils library "Fault tree analysis diagrams" contains 12 symbols for drawing FTA diagrams in the ConceptDraw PRO diagramming and vector drawing software extended with the Fault Tree Analysis Diagrams solution from the Engineering area of ConceptDraw Solution Park.
www.conceptdraw.com/ solution-park/ engineering-fault-tree-analysis-diagrams
www.conceptdraw.com/ solution-park/ engineering-fault-tree-analysis-diagrams
AND gate

Priority AND gate

OR gate

Inhibit gate

XOR gate

Event

Basic event

Undeveloped event

House event

Conditional event

Transfer symbol

Voting gate

- Fishbone Diagram Vs Decision Tree
- Decision tree flowchart | Decision Making | Decision Tree Analysis ...
- Decision Tree Template Visio
- Decision tree | Root cause analysis tree diagram - Personal problem ...
- Problem Solution Tree Templates
- Decision tree | Decision Making | Fault Tree Diagram | Decision Tree
- Cause and Effect Analysis | Decision Making | Fault Tree Diagram ...
- Decision Tree Diagram For Atm System
- Discover Your Ancestry with Family Tree Solution
- Decision Making | Decision tree | Influence Diagram | Decision ...
- Decision Making | Website Wireframe | Wireframing | Decision Tree ...
- Solution Tree Of Project Management
- Decision tree diagram | Marketing Diagrams | MS Visio Look a Like ...
- Decision tree diagram | How to Draw Business Process Diagrams ...
- Decision Making | Fault Tree Diagram | Marketing Diagrams ...
- Decision Making | Derivative works decision tree | Influence ...
- Decision tree | Fault Tree Diagram | Marketing Charts | Decision ...
- Decision tree | Fault Tree Diagram | Influence Diagram | Example Of ...
- Decision Tree Diagram For Online Shopping System