, t chart, decision matrix, decision tree analysis") Decision Making
Decision Making
The Decision Making solution offers the set of professionally developed examples, powerful drawing tools and a wide range of libraries with specific ready-made vector decision icons, decision pictograms, decision flowchart elements, decision tree icons, decision signs arrows, and callouts, allowing the decision maker (even without drawing and design skills) to easily construct Decision diagrams, Business decision maps, Decision flowcharts, Decision trees, Decision matrix, T Chart, Influence diagrams, which are powerful in questions of decision making, holding decision tree analysis and Analytic Hierarchy Process (AHP), visual decomposition the decision problem into hierarchy of easily comprehensible sub-problems and solving them without any efforts.
 Website Wireframe
The innovative Website Wireframe solution enhances the ConceptDraw PRO v10 functionality with newest wireframe tools, libraries with variety of predesigned icons, symbols, buttons, graphics, forms, boxes, and many other vector elements, templates and professionally designed samples, which make it the best wireframing software. Website Wireframe solution gives you significant advantages when designing and maintaining websites, creating skeletal and content-free depictions of website structure, making website prototypes and planning the content arrangement before committing to design, also speeds up the processes of sketching, producing and sharing wireframe examples of website style and interface design.
Wireframing

 Site Plans
Vivid and enticing plan is the starting point in landscape design and site plan design, it reflects the main design idea and gives instantly a vision of the end result after implementation of this plan. Moreover site plan, architectural plan, detailed engineering documents and landscape sketches are obligatory when designing large projects of single and multi-floor buildings.
Fault Tree Diagram

 Marketing Diagrams
Marketing Diagrams solution extends ConceptDraw PRO diagramming software with abundance of samples, templates and vector design elements intended for easy graphical visualization and drawing different types of Marketing diagrams and graphs, including Branding Strategies Diagram, Five Forces Model Diagram, Decision Tree Diagram, Puzzle Diagram, Step Diagram, Process Chart, Strategy Map, Funnel Diagram, Value Chain Diagram, Ladder of Customer Loyalty Diagram, Leaky Bucket Diagram, Promotional Mix Diagram, Service-Goods Continuum Diagram, Six Markets Model Diagram, Sources of Customer Satisfaction Diagram, etc. Analyze effectively the marketing activity of your company and apply the optimal marketing methods with ConceptDraw PRO software.
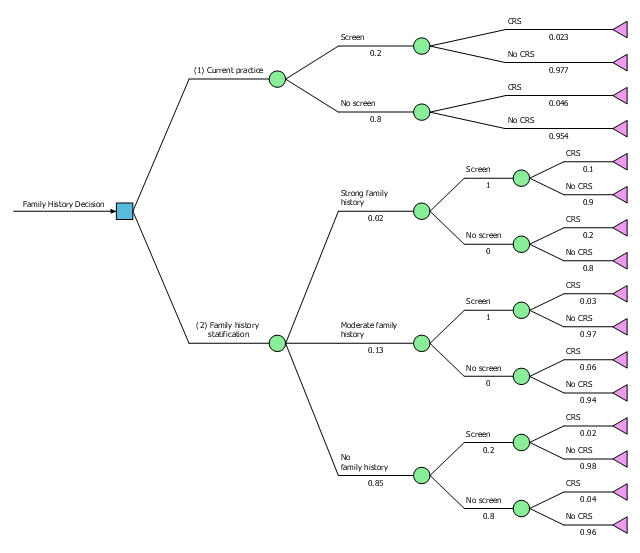
This example was designed on the base of Figure 4.33 "Decision Tree Comparing Colorectal Screening Current Practice with a Targeted Family History Strategy" from the "Principles of Epidemiology in Public Health Practice, Third Edition. An Introduction to Applied Epidemiology and Biostatistics. Self-Study Course SS1978. Lesson 4: Displaying Public Health Data. Section 4: Other Data Displays" on the Centers for Disease Control and Prevention (CDC) website.
"The graph shows a decision tree with outcomes, and probabilities. In this case, a family history decision tree has 16 potential outcomes."
[cdc.gov/ ophss/ csels/ dsepd/ ss1978/ lesson4/ section4.html]
"A decision tree is a decision support tool that uses a tree-like graph or model of decisions and their possible consequences, including chance event outcomes, resource costs, and utility. It is one way to display an algorithm that only contains conditional control statements.
Decision trees are commonly used in operations research, specifically in decision analysis, to help identify a strategy most likely to reach a goal, but are also a popular tool in machine learning." [Decision tree. Wikipedia]
The diagram example "Decision tree" was designed using ConceptDraw software extended with Decision Making solution from Management area of ConceptDraw Solution Park.
Decision diagram example
PDPC

 Block Diagrams
Block diagrams solution extends ConceptDraw PRO software with templates, samples and libraries of vector stencils for drawing the block diagrams.
Cross-Functional Flowchart


- Web Development Decision Tree
- Tree Structure Web Design
- ConceptDraw Arrows10 Technology | Designing A Decision Tree
- Marketing Diagrams | Block Diagrams | | Interactive Decision Tree ...
- Web Development Flowchart
- Decision Tree Structure
- Decision Tree Symbols
- Interactive Decision Tree
- Decision Tree In Software Engineering With Example