Political Science
Political science is a social science discipline dealing with the systematic study of the state, its organs and institutions, government, power, and politics. Plus, political science studies the political organizations, activities in making and administering laws, state regulation, and relations at the international, national, and local levels. It explores the processes, systems, and political dynamics of different countries and regions of the world, and allows comparing them.
Political science includes the theory and practice of politics, the study of public policies and political behavior, the analysis of political activities, thoughts, ideas, and associated laws and constitutions. The political principles are studied by political science and drawn conclusions are successfully applied to solve political issues and problems. It also analyzes, makes recommendations, and predicts critical issues affecting our lives, including globalization, climate change, terrorism, civil rights, and diplomacy.
Political science has ancient roots and originates almost 2,500 years ago. The works of Plato and Aristotle are the confirmation of this. Political science is a descriptive science, it develops theories and draws conclusions, assumes detection relationships between political events, conditions, reasons, and factors. It describes and compares the state in the past, present, and future. It compares activities in conditions of changing standards with the aim of improving political activities, developing the laws contributing to the state's growth and development.
Political science is methodologically diverse, it applies empirical methods and techniques and generally scientific methods of analysis in politics and state management. Empirical methods used in political science include observations, process tracing, field experiments, surveys, interviews, case studies, ethnography, participant observation, historical analysis, etc. Theoretical tools like game theory and agent-based models are also used.
Example 1. Political Science
Political science explores election or voting results, analyzes statistics, makes conclusions why governments adopt particular policies, what issues drive citizens to vote for some political party. It also supposes the development and conduction surveys to predict political opinions. It collects and analyzes the results of public opinion surveys, tracks current events, political decisions, and assesses their impact. Political science measures the success of governance by tracking and evaluating many factors like economical stability, material wealth, justice, peace, public health, and spirit. It does not give precise predictions, measurements, and numbers.
Political science is closely intertwined with sociology, philosophy, law, psychology. It is linked to history and allows prediction of the future political behavior and social trends. Because studying the events in the past gives a better understanding of the present and a forecast of the future. It also intersects with a wide variety of different fields like anthropology, economics, international relations, geography, journalism, social policy, cognitive neuroscience, and many more, and applies their methods. Political science is related to public policy, administration, internal and external politics, political economy, political methodology, social research.
Political science is observational, not experimental science, it includes a lot of observation methods in order to identify patterns, make conclusions, build political theories, draw generalizations. It is divided into comparative politics, international relations, and political theory, measurements, and numbers. It uses a lot of sources including primary sources like historical documents, official records, and secondary sources like articles in journals and mass media, results of surveys, experiments, statistical analysis, research, case studies, model buildings.
Outline easily the main principles of political science, key points, methods, techniques used by political science, three dimensional axis of politics, and more important issues in an illustrative and visual way in ConceptDraw DIAGRAM software with the use of powerful Politics Infographics solution.

Example 2. Domestic Policy Library Design Elements
The ConceptDraw tools are simple, intuitive, and timesaving for politics-related people. Politics Infographics solution includes a large set of pre-made samples and examples, and 8 libraries with numerous vector design objects for drawing professional-looking infographics without efforts.
Among the included solution libraries are:
- Political People Library
- Civil Society Library
- Domestic Policy Library
- Election Library
- Foreign Policy Library
- Military Policy Library
- US Politics Library
- War Library

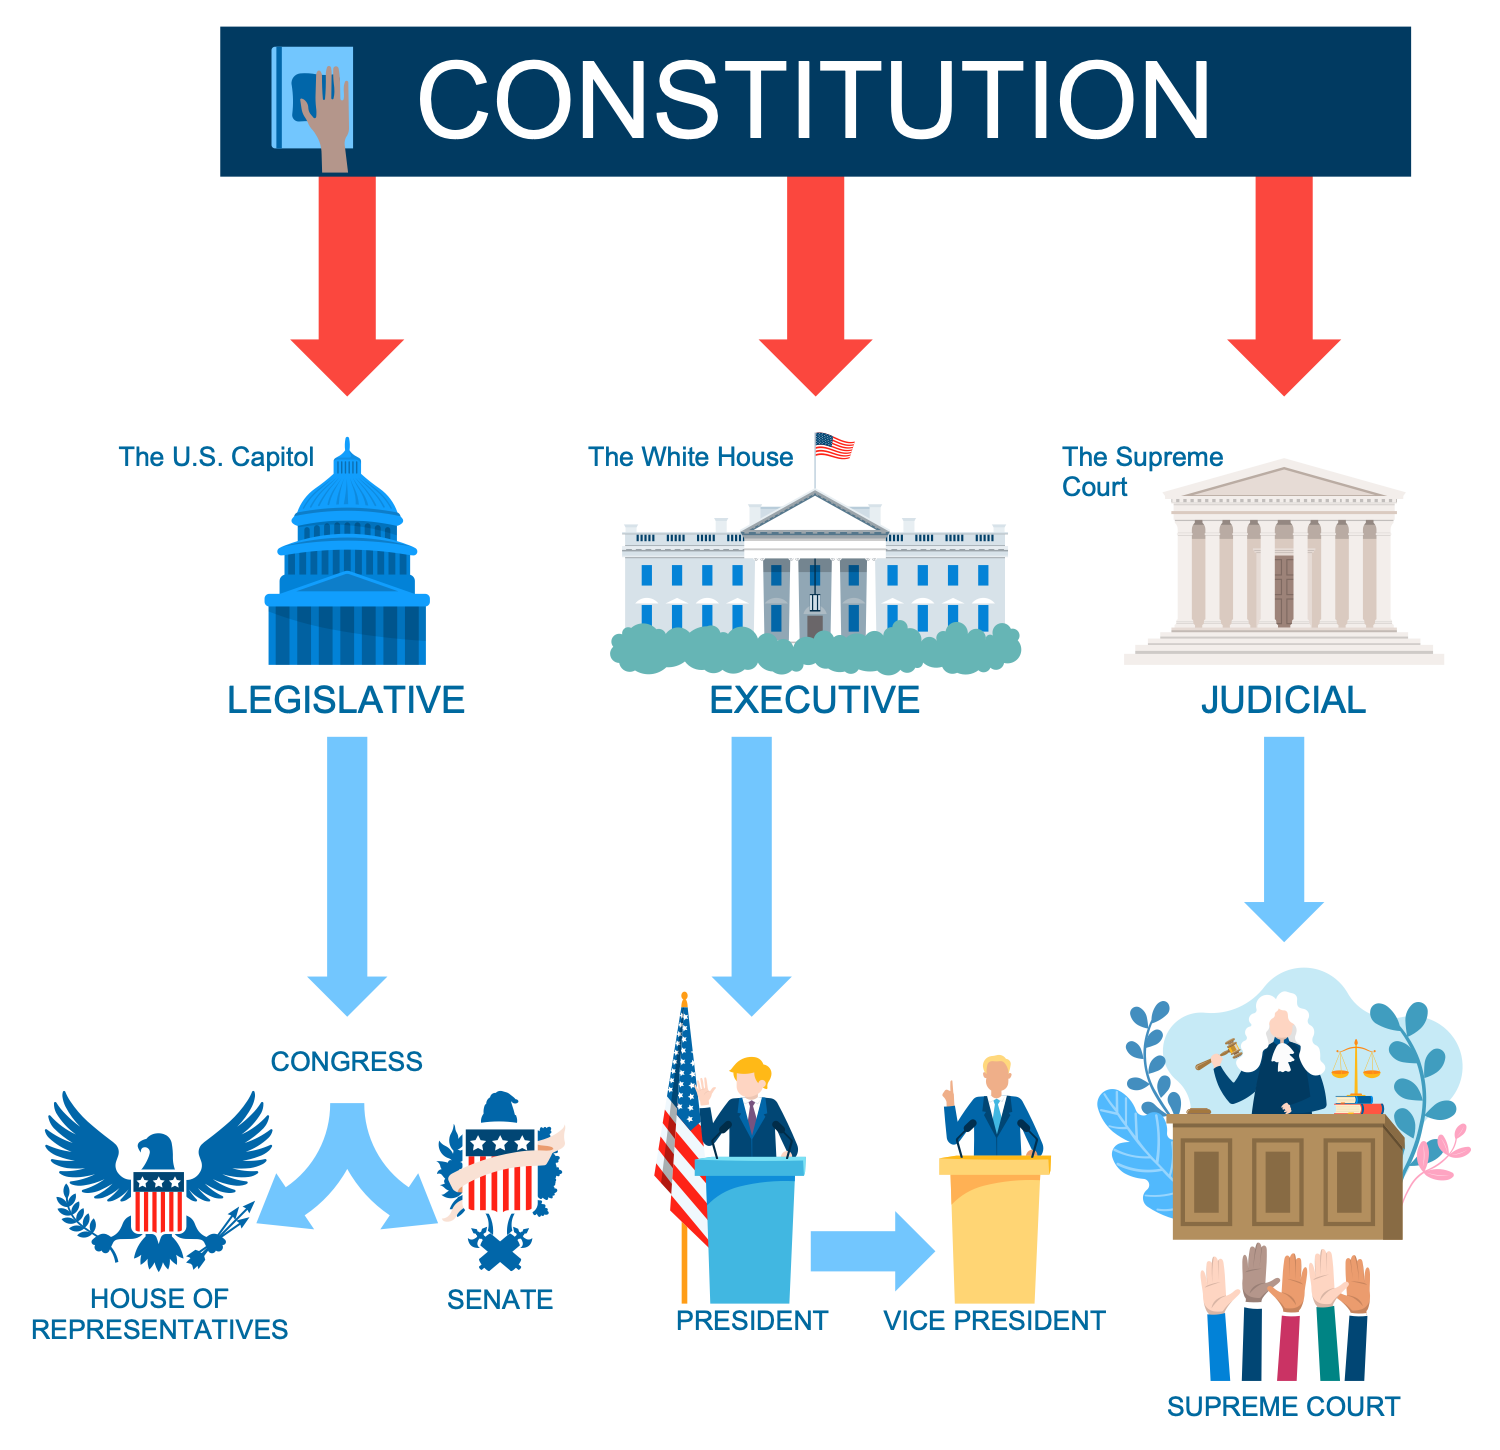
Example 3. Politics Infographic - Politics of Japan
The infographics you see on this page were created in ConceptDraw DIAGRAM software using the Politics Infographics Solution and its pre-made pictograms and clipart. They successfully demonstrate the solution's capabilities and professional results you can achieve. An experienced user spent 10-15 minutes creating each of these samples.
Use the powerful tools of the Politics Infographics Solution for ConceptDraw DIAGRAM software to create your own infographics and diagrams of any complexity fast and easy, and then successfully use them in your work and personal activity.
All source documents are vector graphic documents. They are available for reviewing, modifying, or converting to a variety of formats (PDF file, MS PowerPoint, MS Visio, and many more graphic formats) from the ConceptDraw STORE. The Politics Infographics Solution is available for all ConceptDraw DIAGRAM users.
TEN RELATED HOW TO's:
Accounting is a cornerstone of any business, it’s basement. If you want to have a visual representation of your finance management, use audit flowchart symbols to document the money flow. Although some would say that accounting is boring, it is very a responsible duty.
The audit flowchart symbols is supplied with ConceptDraw Audit Flowcharts solution as a vector objects library. Together with Conceptdraw Drawing capabilities it forms the helpful tool for audit process planning and setting the steps of audit by designing audit flow charts. Audit Flow charts are used to organize fiscal information tracking process as well as in accounting, finance and investment management.
Picture: Audit Flowchart Symbols
Related Solution:
Data structure diagram (DSD) is intended for description of conceptual models of data (concepts and connections between them) in the graphic format for more obviousness. Data structure diagram includes entities description, connections between them and obligatory conditions and requirements which connect them. Create Data structure diagram with ConceptDraw DIAGRAM.
Picture: Data structure diagram with ConceptDraw DIAGRAM
Diagramming is an astonishing way to visualize business processes. The list of the most common business process flowchart symbols is quite long starting from basic flowcharts, continuing with SIPOC diagrams. Business process modeling was never easier than now, with special ConceptDraw Business Process Mapping solution.
To carry out all professional standard requirements for business processes mapping, it is necessarily to follow the special graphical notations. ConceptDraw Business Process Mapping solution offers an exhaustive suite of tools to aid business process mapping. There are three vector libraries SIPOC Diagrams, Business Process Flowcharts, and Swim Lanes that contains totally more than 50 symbols of standard BPM notations. This is all that professionals need to effectively evaluate and manage quality in business processes.
Picture: Business Process Flowchart Symbols
Related Solution:
If you need to describe some process, diagramming is a perfect tool for almost any imaginable purpose. The set of the most commonly used flow charts symbols is quite wide and includes symbols for operations, processes, data inputs and outputs. You can see the full list of all the symbols used for flowcharting in Flowcharts solution from Diagrams area in ConceptDraw Solution Park.
A flow chart is often used for visual representation of a sequential process flow. The flowchart approach to any process is to divide it into some sequential actions. What makes a flow chart so popular and clear to make out is the set of standard flowchart symbols that has the same reading independently from processes described with their applying. The current drawing represents the vector library containing the pack of standard flowchart symbols. This library is supplied with ConceptDraw Flowcharts solution.
Picture: Flow Chart Symbols
Related Solution:
A flowchart is a simple but very functional tool when it comes to understanding a workflow or to removing unnecessary stages from a process. When drawing flowcharts, keep in mind that there are four common types of flowcharts, like document flowcharts and data flowcharts that show control over a data or document flow over a system. To show controls on a physical level, use system flowcharts. In addition, to show controls in a program, you can draw a program flowchart.
This flowchart diagram represents the piece of an article editing process, that involves the author and editor. It was created using the Basic Flowchart notation that consists from the basic flowchart symbols. The start and the end of the process are indicated with "Terminator" symbols. The "Process" symbols show the action steps consisting from making edits and searching for a compromise, when the author does not agree with the suggestions of the editor. The "Process" symbol is the general symbol in process flowcharts. The "Decision" symbol indicates a branching in the process flow. There are two branches indicated by a Decision shape in the current flowchart (Yes/No, Disagree/Agree). This basic flowchart can be used as a repeating unit in the workflow diagram describing the working process of some editorial office.
Picture: Types of Flowcharts
Related Solution:
Use ConceptDraw DIAGRAM diagramming and business graphics software to draw your own flowcharts of computer algorithms.
Picture: Process Flow app for macOS
Related Solution:
The ConceptDraw Flowchart component includes a set of samples and templates. This geathered as flowchart maker toolbox which focused on drawing flowcharts of any industry standards.
Picture: Flowchart Components
Related Solution:
Data flow diagrams are the graphical tool, used in the visualization of data flow of some data processing systems. It is the valuable process modeling tool. Also designing DFD is the important component of the initial part of any information system development project. The standard symbols are used to represent the interaction of a system components and how various kinds of components influence on data flow. The ConceptDraw Data Flow Diagrams solution is design to assist professional software engineers in making DFDs according to Gane and Sarson, and Yourdon and Coad notations.
Do you imagine yourself as a successful IT specialist? To your mind, they all use data flow diagram examples to learn and to get inspired. Aren’t you still with us?
Picture: Data Flow Diagram Examples
Related Solution:
ConceptDraw DIAGRAM is a world-class diagramming platform that lets you display, communicate, and present dynamically. It′s powerful enough to draw everything from basic flowcharts to complex engineering schematics.
Video tutorials on ConceptDraw products. Try it today!
Picture: Business Process Mapping — How to Map a Work Process
Related Solutions:
Event-Driven Process Chain Diagrams for improvement throughout an organisation.
ConceptDraw DIAGRAM - software that reduces the time needed to create a business process model.
Picture: Graphical Symbols to use in EPC diagrams
Related Solution: