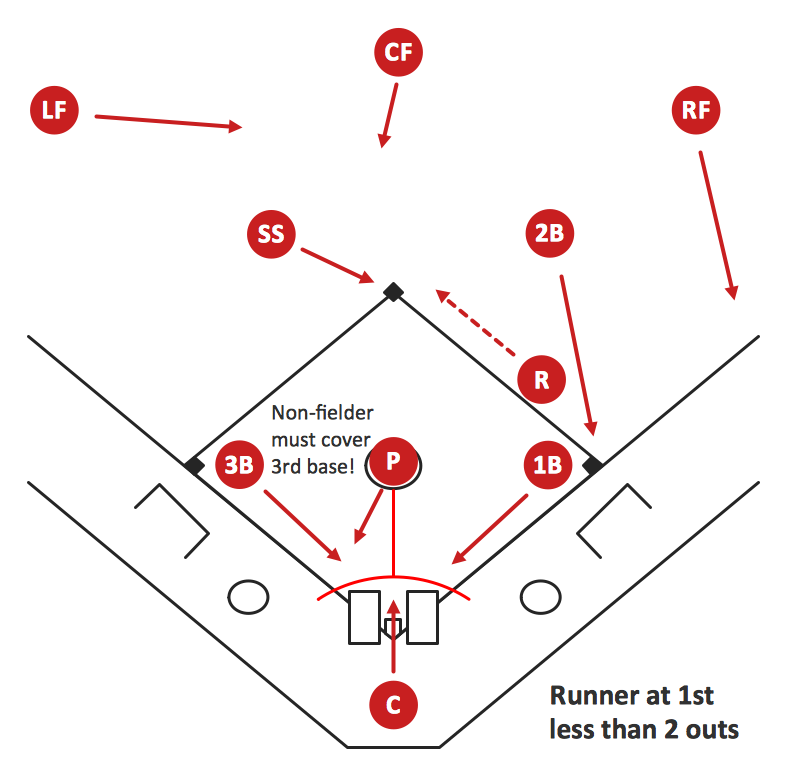
Sample 1. Baseball Diagram – Basic Bunt Coverage – Runner at 1st.
This diagram was created in ConceptDraw DIAGRAM using the "Baseball Positions" library from the Baseball Solution. An experienced user spent 10 minutes creating this sample.
It demonstrates a portion of the solution's capabilities and the professional results you can achieve.
All source documents are vector graphic documents. They are available for reviewing, modifying, or converting to a variety of formats (PDF file, MS PowerPoint, MS Visio, and many other graphic formats) from the ConceptDraw STORE. The Baseball Solution is available for all ConceptDraw DIAGRAM or later users.
TEN RELATED HOW TO's:
This sample was created in ConceptDraw DIAGRAM diagramming and vector drawing software using the Computer and Networks solution from Computer and Networks area of ConceptDraw Solution Park.
A Daisy Chain is the simple computer network. It is the easiest way to add more Ethernet devices into the network. In the Daisy Chain network one computer is connected to the next without any intervening devices, thus the message is sent from one computer to the next and then to the next and so on. A Daisy Chain can be linear or ring
Picture: Daisy Chain Network Topology
Related Solution:
ConceptDraw DIAGRAM software extended with the Baseball solution delivers libraries, templates and samples allowing baseball fans or specialists to draw baseball-related schemas in minutes.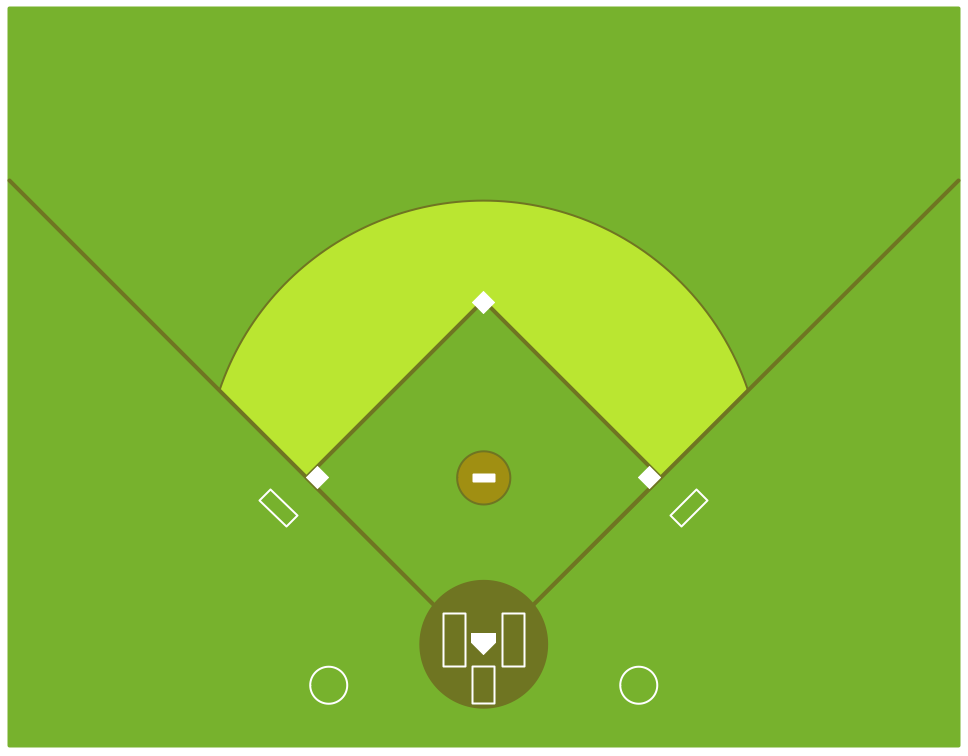
Picture: Colored Baseball Field Diagram
Related Solution:
Is it possible to develop a diagram as quickly as the ideas come to you? The innovative ConceptDraw Arrows10 Technology included in ConceptDraw DIAGRAM is a powerful drawing tool that changes the way diagrams are produced.
While making the drawing process easier and faster.
Picture: How to draw a Cross-Functional Flowchart
Related Solution:
The Soccer solution from the Sport area of ConceptDraw Solution Park is designed as a tool that helps produce soccer illustrations of any complexity in minutes. You can quick and easy design the professional looking plan of the soccer field with set up dimensions.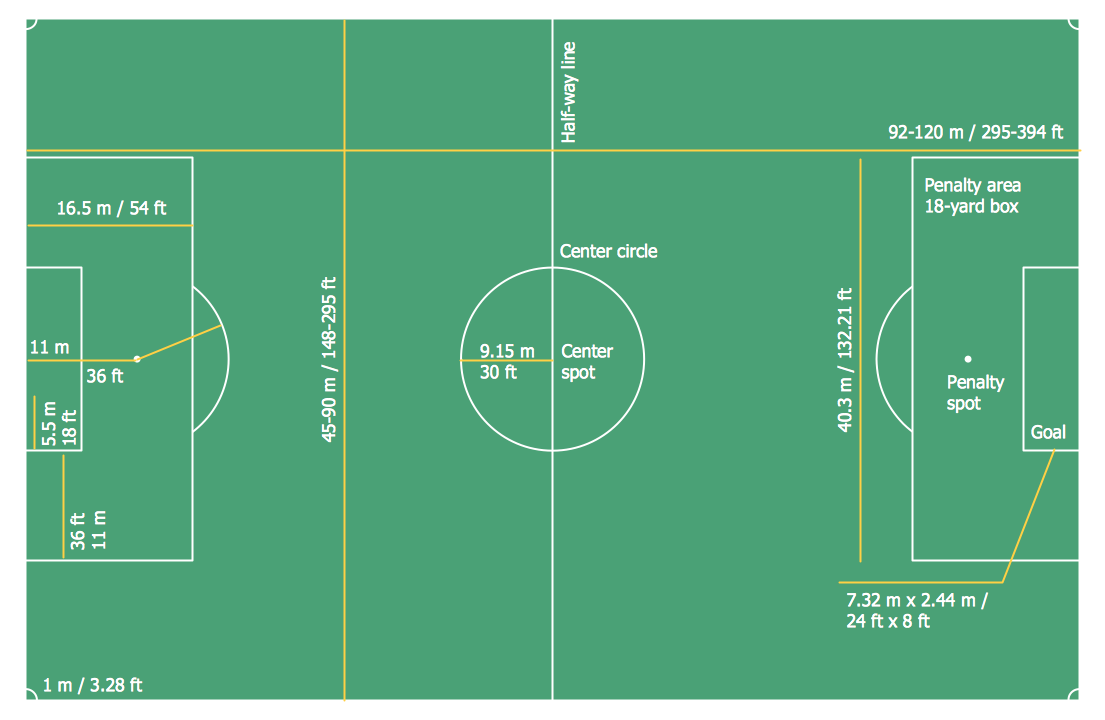
Picture: Soccer (Football) Dimensions
Related Solution:
A flowchart is a powerful tool for examining processes. It helps improving processes a lot, as it becomes much easier to communicate between involved people, to identify potential problems and to optimize workflow. There are flowcharts of different shapes, sizes and types of flowchart vary from quite basic process flowcharts to complex program flowcharts. Nevertheless, all these diagrams use the same set of special symbols like arrows to connect blocks, parallelogram to show data receiving or rectangles for showing process steps.
Basic flowcharts are used to represent a simple process algorithm. A basic flowchart notation consists of rectangles (business processes), arrows (the flow of information, documents, etc.). The same notation is used in items such as the "decision", which allow you to do the branching. To indicate the start of the entire business process and its termination can be used the "Terminator" element. The advantages of Basic Flowchart are simplicity and clarity. With it you can quickly describe the business process steps. Creating of Basic Flowchart does not require any special knowledge, as easily understand by employees with different levels of education and IQ.
Picture: Types of Flowchart: Comprehensive Overview
Related Solution:
Structured-systems analysis and design method uses data flow diagrams to represent the process of data flowing through a system. Talking about this might be useless without a proper example of DFD for online store (Data Flow Diagram). This DFD example shows all the distinctness that a diagram can bring into a scattered data structure.
Data flow diagrams are used to show how data is processed within some business processes. Making DFD is a common practice for business process modeling and analysis. This diagram represents the online store business flow. It describes inputs and outputs within online selling process and depicts the interactions between its participants. This DF diagram can be used by system analysts to create an overview of a business, to study and discover its inherent strengths and weak points.
Picture: Example of DFD for Online Store (Data Flow Diagram)
Related Solution:
Target Diagram is a convenient and visual way of presentation information which is popular and widely used in marketing, business and economics. ConceptDraw DIAGRAM diagramming and vector drawing software extended with Target and Circular Diagrams solution from the Marketing area of ConceptDraw Solution Park is ideal for fast and easy drawing a Target Diagram.
Picture: Target Diagram
Related Solution:
If you are baseball coach or fan, you need convenient and useful software to design the baseball-related diagrams. In this case ConceptDraw DIAGRAM diagramming and vector drawing software is a real godsend for you!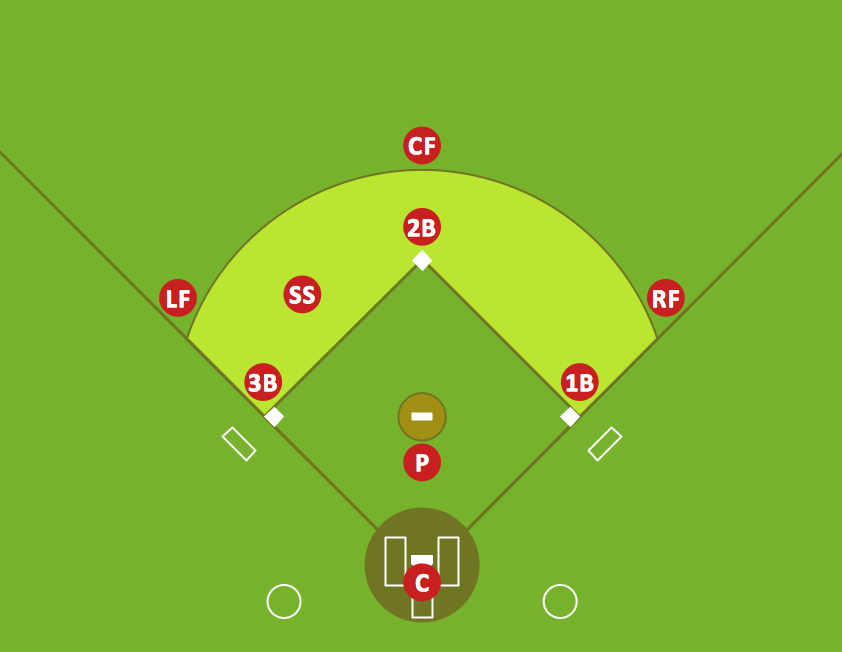
Picture: Infield Positioning for Baseball Situations
Related Solution:
Visual depiction is key secret to successful understanding baseball strike zone dimentions. Baseball strike zone diagram illustrated using ConceptDraw DIAGRAM software enhanced with the Baseball solution.
Picture: Baseball — Pitching and the Strike Zone
Related Solution:
Fishbone, Ishikawa or Cause and Effect diagram helps understand the reasons of completed or potential actions by structuring their causes in smaller categories. Also, one can use it to see how the contributing factors are related to each other. In everyday company routine, a Cause and Effect diagram is helpful with a number of regular activities like brainstorming, project management, and problem solving.
How to Construct a Fishbone Diagram? Construction a Fishbone diagram in professional diagramming software ConceptDraw DIAGRAM is more easy than you think. Just use the predesigned vector elements from the Fishbone Diagrams library for Fishbone Diagrams solution or one of plenty Fishbone templates and examples, and you will get a Cause and Effect diagram in minutes.
Picture: How to Construct a Fishbone Diagram
Related Solution: