Influence Diagram

Influence diagram represents the directed acyclic graph with three types of nodes and three types of arcs that connect the nodes. Decision node is drawn as a rectangle, Uncertainty node is drawn as an oval, Value node is drawn as an octagon.
Influence Diagram Software

This sample shows the Influence diagram. It is a directed acyclic graph with three types of nodes: Decision node is drawn as a rectangle, Uncertainty node is drawn as an oval, Value node is drawn as an octagon. The nodes are connected with arcs.
Types of Flowcharts


IDEF4 Standard

IDEF3 Standard

IDEF0 standard with ConceptDraw PRO

According to the IDEF0 standard any process can be described in the form of a block (Activity Box) which has inputs and outputs. The process consists in transformation of inputs into outputs under the influence of the management and in the presence of necessary resources. Outputs of the given process later on can be either inputs for the next process or resources, or management means.
 Education Mind Maps
This solution extends ConceptDraw MINDMAP software with scientific and educational mind maps for educational documents, presentations, and websites.
HelpDesk
How To Create Root Cause Analysis Diagram Using ConceptDraw Office

 Stakeholder Onion Diagrams
The Stakeholder Onion Diagram is often used as a way to view the relationships of stakeholders to a project goal. A basic Onion Diagram contains a rich information. It shows significance of stakeholders that will have has influence to the success achieve
IDEF9 Standard

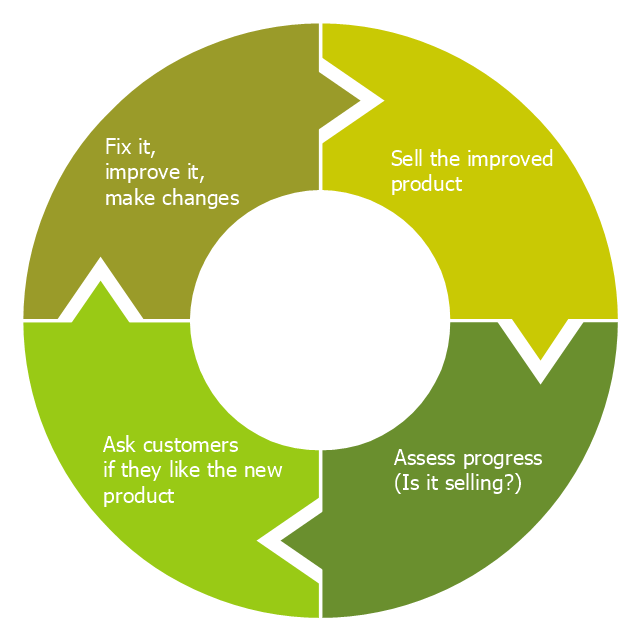
"Feedback is a process in which information about the past or the present influences the same phenomenon in the present or future. As part of a chain of cause-and-effect that forms a circuit or loop, the event is said to "feed back" into itself. ...
Feedback loop - the complete causal path that leads from the initial detection of the gap to the subsequent modification of the gap. ...
Feedback is commonly divided into two types - usually termed positive and negative. The terms can be applied in two contexts:
(1) the altering of the gap between reference and actual values of a parameter, based on whether the gap is widening (positive) or narrowing (negative),
(2) the valence of the action or effect that alters the gap, based on whether it has a happy (positive) or unhappy (negative) emotional connotation to the recipient or observer." [Feedback. Wikipedia]
This cycle diagram example was redesigned from the Wikimedia Commons file: Business Feedback Loop.jpg. [commons.wikimedia.org/ wiki/ File:Business_ Feedback_ Loop.jpg]
This file is made available under the Creative Commons CC0 1.0 Universal Public Domain Dedication. [creativecommons.org/ publicdomain/ zero/ 1.0/ deed.en]
The ring chart example "Business feedback loop" was created using the ConceptDraw PRO diagramming and vector drawing software extended with the Target and Circular Diagrams solution from the Marketing area of ConceptDraw Solution Park.
www.conceptdraw.com/ solution-park/ marketing-target-and-circular-diagrams
Ring chart
- Influence Diagram Software | Types of Flowcharts
- Influence Diagram Software | Influence Diagram | Types of ...
- Types of Flowcharts | Influence Diagram | How To Create the ...
- Decision tree diagram | Decision Making | Influence Diagram ...
- Basic Diagramming | Influence Diagram Software | Scatter Chart ...
- Cross-Functional Flowchart | Influence Diagram | Influence Diagram ...
- Block diagram - Customer decision making | Influence Diagram ...
- Influence Diagram Software | SDL Diagram | Football | Examples Of ...
- How To Create Root Cause Analysis Diagram | Types of Flowcharts ...
- Types of Flowcharts | Program Evaluation and Review Technique ...
- Types of Welding in Flowchart | Decision tree diagram | Computer ...
- Mathematics Symbols | Mathematics | Types of Flowchart - Overview ...
- Basic Diagramming | Venn diagrams with ConceptDraw PRO ...
- The Best Drawing Program for Mac | Best Diagramming Software for ...
- Block diagram - Customer decision making | Block Diagrams | Work ...
- Purchase Process Flow Chart . Accounting Flowchart Example ...
- Cross-Functional Flowchart | Marketing Diagrams | Marketing Charts ...
- Basic Diagramming | Scientific Symbols Chart | Scatter Chart ...
- Basic Diagramming | Network Topologies | Chart Software for Better ...
- Types of Flowcharts | Workflow Diagram | Process Flowchart ...
- ERD | Entity Relationship Diagrams, ERD Software for Mac and Win
- Flowchart | Basic Flowchart Symbols and Meaning
- Flowchart | Flowchart Design - Symbols, Shapes, Stencils and Icons
- Flowchart | Flow Chart Symbols
- Electrical | Electrical Drawing - Wiring and Circuits Schematics
- Flowchart | Common Flowchart Symbols
- Flowchart | Common Flowchart Symbols