Venn Diagram Examples for Problem Solving. Environmental Social Science. Human Sustainability Confluence

Create your Venn diagrams for problem solving in environmental social science using the ConceptDraw DIAGRAM diagramming and vector drawing software extended with the Venn Diagrams solution from the area "Diagrams" of ConceptDraw Solution Park.
Basic Audit Flowchart. Flowchart Examples

The Audit Flowcharts are widely used in the financial management, accounting, money management and in many others fields.
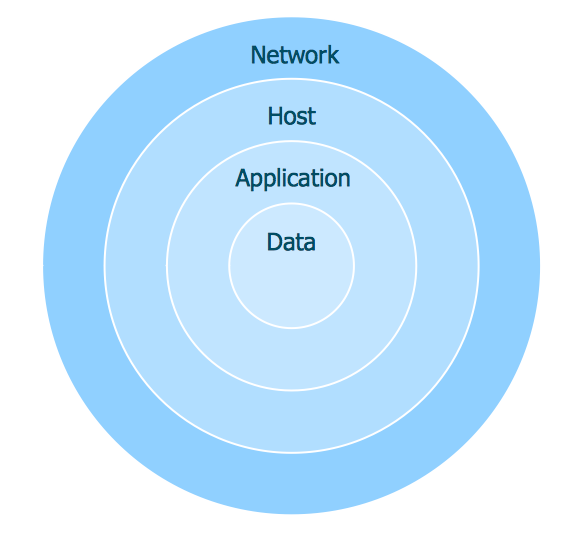
Venn Diagram

 Venn Diagrams
Venn Diagrams are actively used to illustrate simple set relationships in set theory and probability theory, logic and statistics, mathematics and computer science, linguistics, sociology, and marketing. Venn Diagrams are also often used to visually summarize the status and future viability of a project.
Venn Diagrams

ConceptDraw DIAGRAM diagramming and vector drawing software extended with Venn Diagrams solution from "Diagrams" area offers set of useful drawing tools for easy creating the Venn Diagrams for any quantity of sets.
Marketing and Sales Organization chart. Organization chart Example

This sample shows the Organizational Chart that displays the Sales and marketing (CRM) module. Using the ready-to-use predesigned objects, samples and templates from the Organizational Charts Solution for ConceptDraw DIAGRAM you can create your own orgchart professional quick and easy.
Interactive Venn Diagram
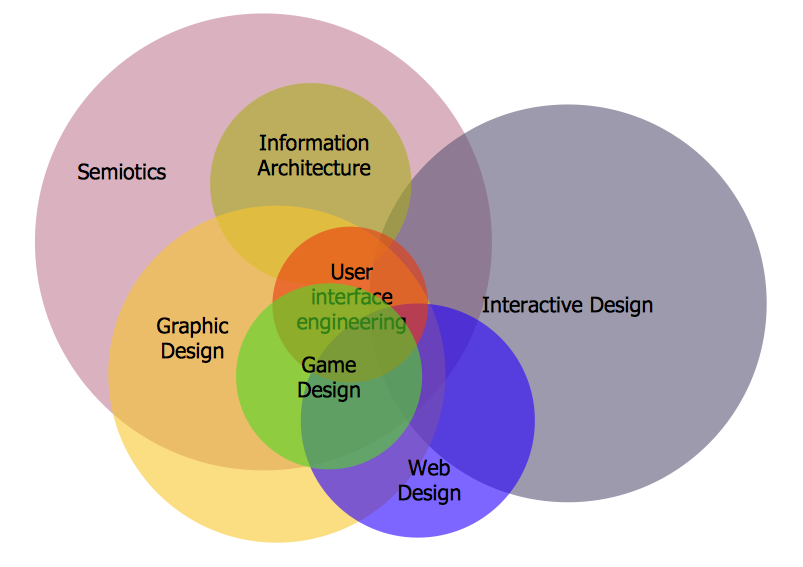
Venn Diagrams designed in ConceptDraw DIAGRAM are visual, bright, colorful, so they can be successfully used in different reports, appearances on the conferences, meetings.
Relative Circular Diagram
Target and Circular Diagrams Solution with large number of templates and samples of Circular Diagrams, and Circular Diagram library with various vector objects will help you in your diagramming process.
Feature Comparison Chart Software

This sample shows the Feature Comparison Chart of the digital scouting cameras. It can be useful for digital cameras production field, marketing, sales, etc.
3 Circle Venn. Venn Diagram Example

Flowchart of Products. Flowchart Examples

A Flowchart is a graphically representation of the process that step-by-step lead to the solution the problem. The geometric figures on the Flowchart represent the steps of the process and are connected with arrows that show the sequence of the actions. The Flowcharts are widely used in engineering, architecture, science, analytics, government, politics, business, marketing, manufacturing, administration, etc.
Competitor Analysis

Relative Value Chart Software

Relative values are widely used in:business, economics, investment, management, marketing, statistics, etc.
ConceptDraw DIAGRAM software is the best for drawing professional looking Relative Value Charts. ConceptDraw DIAGRAM provides Divided Bar Diagrams solution from the Graphs and Charts Area of ConceptDraw Solution Park.
CORRECTIVE ACTIONS PLANNING. Risk Diagram (PDPC)


- Venn Diagram | Pyramid Chart Examples | Relative Value Chart ...
- Pie Chart On Sustainable Development
- Venn Diagram Examples for Problem Solving. Environmental Social ...
- Venn diagram - Path to sustainable development | Stakeholder ...
- Venn diagram - Path to sustainable development | Venn Diagram ...
- Sustainable Development Examples
- Venn Diagram Examples for Problem Solving. Environmental Social ...
- Venn Diagram | Pyramid Chart Examples | Ecosystem goods and ...
- Venn Diagram Examples for Problem Solving. Environmental Social ...
- Venn Diagram Examples for Problem Solving. Environmental Social ...
- Venn diagram - Path to sustainable development | Venn diagrams ...
- Venn diagram - Path to sustainable development | Venn Diagram ...
- Venn Diagrams | Venn Diagram | How to Create a Venn Diagram in ...
- Pie Chart Of Sustainable Development
- Examples Of Sustainable Development Pictures
- Ecosystem goods and services - Segmented pyramid diagram ...
- Venn Diagrams | Pyramid Chart Examples | Venn Diagram ...
- Venn diagram - Path to sustainable development | Venn Diagram ...
- Social Marketing
- Venn Diagram Maker | Venn Diagram Template for Word | Venn ...
- ERD | Entity Relationship Diagrams, ERD Software for Mac and Win
- Flowchart | Basic Flowchart Symbols and Meaning
- Flowchart | Flowchart Design - Symbols, Shapes, Stencils and Icons
- Flowchart | Flow Chart Symbols
- Electrical | Electrical Drawing - Wiring and Circuits Schematics
- Flowchart | Common Flowchart Symbols
- Flowchart | Common Flowchart Symbols