Venn Diagram Examples for Problem Solving. Environmental Social Science. Human Sustainability Confluence

Using Fishbone Diagrams for Problem Solving

Garrett IA Diagrams with ConceptDraw DIAGRAM

SWOT Analysis

Simple Drawing Applications for Mac

Bar Diagrams for Problem Solving. Create manufacturing and economics bar charts with Bar Graphs Solution

This onion diagram sample was created on the base of the figure "Social Ecological Model (SEM)" illustrating the webpage "Cultural Competence" from the US Centers for Disease Control and Prevention (CDC) website.
"Why consider cultural competence?
It is important to communicate effectively to both the disparately affected population(s) of interest as well as other key stakeholders at the community, state, and national levels.
The diagram of the Social Ecological Model (SEM) ... depicts how health behaviors of an individual (inner oval) are influenced by the interpersonal, organizational, community, and public policy contexts and environment in which that person exists. Cultural context resides in the interpersonal band, making it a critical consideration when designing any communication plan. All obesity prevention communications should take the culture (e.g., language, thoughts, communications, actions, customs, beliefs, values, and institutions of racial, ethnic, religious, or social groups) of the target population into consideration to be effective. Interventions that successfully achieve this goal demonstrate cultural competence - behaviors, attitudes, and policies that come together in a system, agency, or among professionals to enable people to work effectively in a cross-cultural situation."
[cdc.gov/ obesity/ health_ equity/ culturalRelevance.html]
The onion diagram example "Social Ecological Model (SEM)" was created using the ConceptDraw PRO diagramming and vector drawing software extended with the Target and Circular Diagrams solution from the Marketing area of ConceptDraw Solution Park.
www.conceptdraw.com/ solution-park/ marketing-target-and-circular-diagrams
Onion diagram
---onion-diagram.png--diagram-flowchart-example.png)
Financial Trade UML Use Case Diagram Example

ConceptDraw DIAGRAM : Able to Leap Tall Buildings in a Single Bound

Competitor Analysis

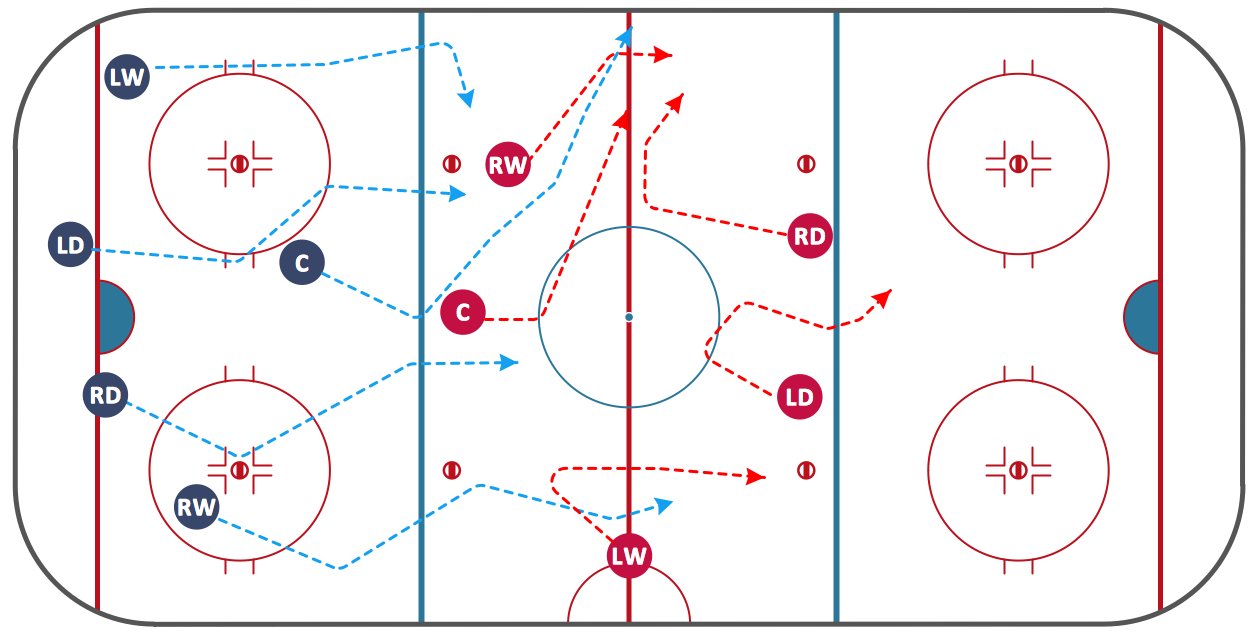
Ice Hockey Diagram — Defensive Strategy — Neutral Zone Trap
 Circle-Spoke Diagrams
Examples of subject areas that are well suited to this approach are marketing, business, products promotion, process modeling, market, resource, time, and cost analysis. Circle-Spoke Diagrams are successfully used in presentations, conferences, management documents, magazines, reportages, reviews, reports, TV, and social media.
 Fishbone Diagrams
The Fishbone Diagrams solution extends ConceptDraw DIAGRAM software with the ability to easily draw the Fishbone Diagrams (Ishikawa Diagrams) to clearly see the cause and effect analysis and also problem solving. The vector graphic diagrams produced using this solution can be used in whitepapers, presentations, datasheets, posters, and published technical material.
Mind Maps for Business - SWOT Analysis

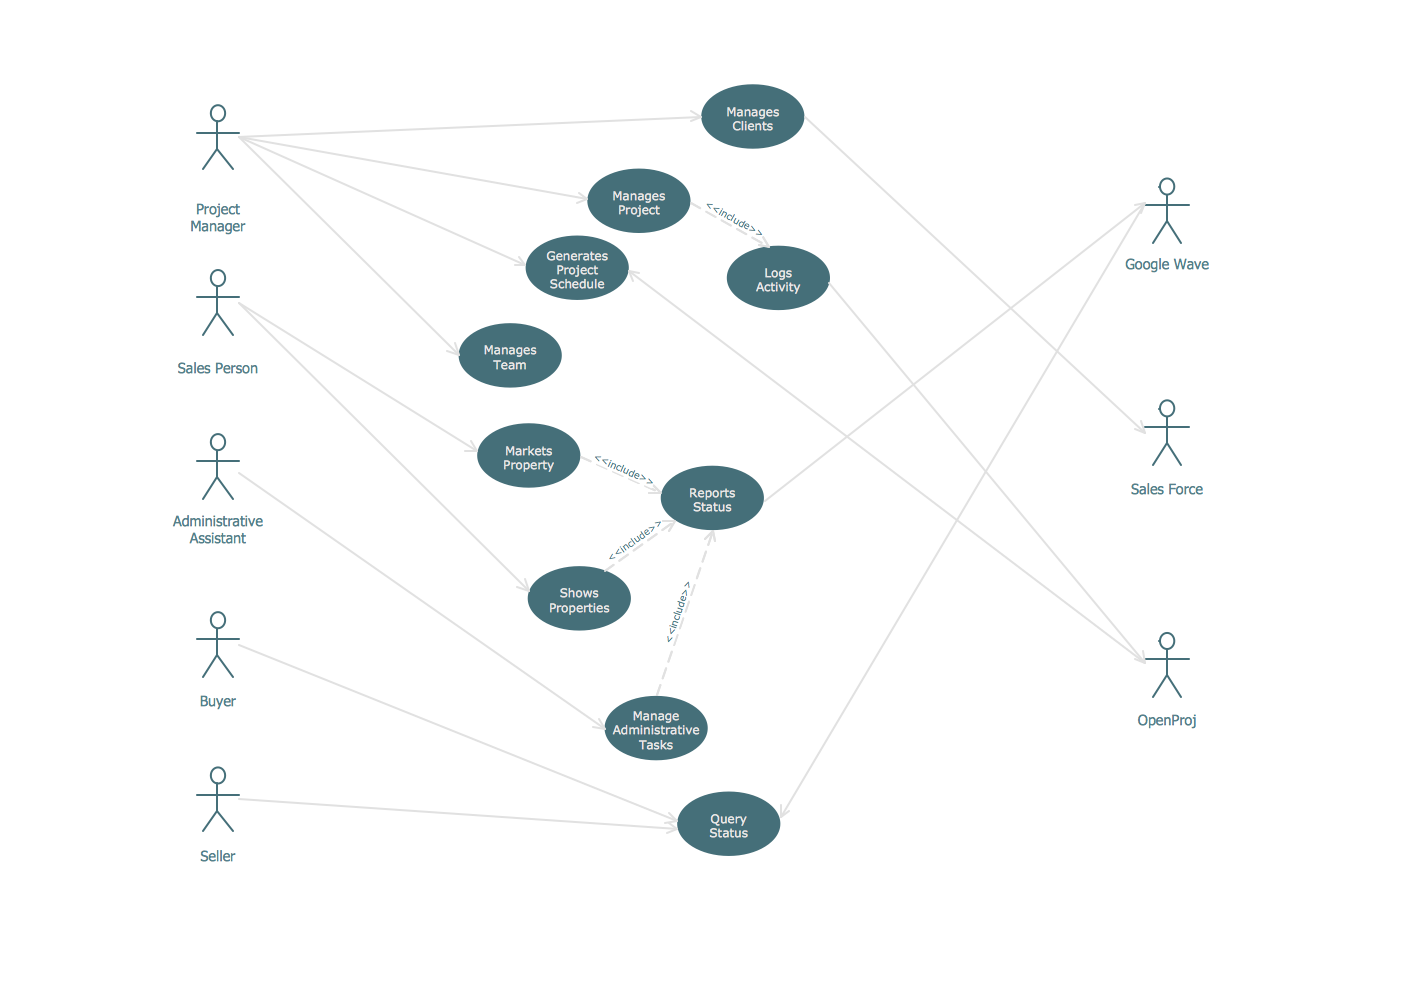
UML Use Case Diagram Example - Estate Agency
- Sustainable Development Of Environment Diagram
- SWOT Analysis | Venn Diagram Examples for Problem Solving ...
- Process Flowchart | UML Deployment Diagram . Design Elements ...
- Social Ecological Model (SEM) - Onion diagram | Venn Diagram ...
- Pie Diagram Related To Environment Problem
- Draw The Diagram Of Business Environment
- Process Flowchart | Social determinants of health | Venn Diagram ...
- Types of Flowchart - Overview | Venn Diagram Examples for ...
- Diagrams Of Business Environment
- Diagram Of Social Science Goal
- Venn Diagram Examples for Problem Solving. Environmental Social
- Steps To Draw Diagram Of Environment
- Map Or Drawing And Diagram Of Environment
- Marketing Environment Diagram Chart
- Environment Diagrams
- Environment Diagram
- Venn Diagram Model Of Sustainable Development
- UML Use Case Diagram Example Social Networking Sites Project ...
- Venn Diagram Examples for Problem Solving. Computer Science ...