Process Flow Diagrams

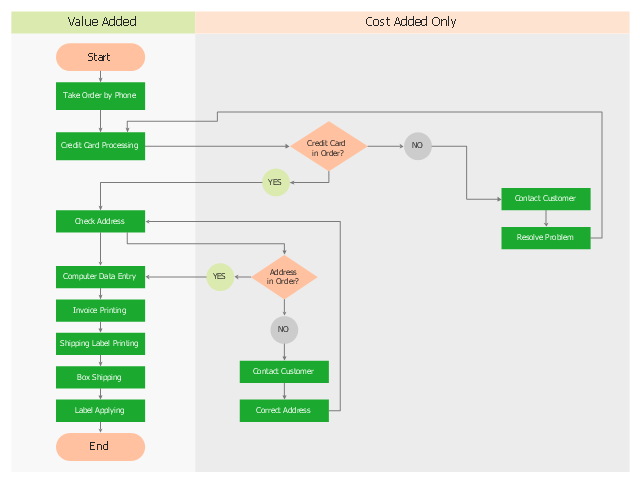
This opportunity flowchart sample shows the order processing flow.
"Opportunity flowcharts are a variation of detailed basic flowcharts. They get their name because they highlight opportunities for improvement. Like all flowcharts, they make the process visible. But they take this idea one step further by separating value-added steps (those essential for making the product or service) from cost-added-only steps (those that are included only to check for or fix problems). ...
An opportunity flowchart is created by rearranging a detailed basic flowchart. The steps needed if everything works perfectly should flow down the left side of the chart. Steps that exist because of problems and inefficiencies flow across the right side." [Flowcharts: Plain & Simple. Inc Staff Joiner Assocs. 1995. P. 60.]
The swim lane diagram example "Opportunity flowchart - Order processing" was created using the ConceptDraw PRO diagramming and vector drawing software extended with the Cross-Functional Flowcharts solution from the Business Processes area of ConceptDraw Solution Park.
Swim lane diagram
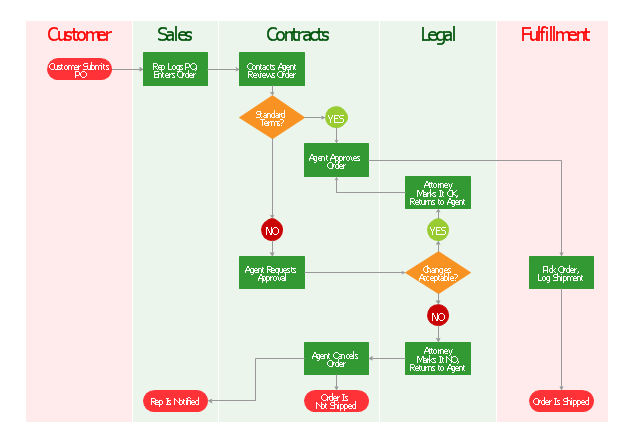
"Order processing is a key element of Order fulfillment. Order processing operations or facilities are commonly called "distribution centers". "Order processing" is the term generally used to describe the process or the work flow associated with the picking, packing and delivery of the packed item(s) to a shipping carrier. The specific "order fulfillment process" or the operational procedures of distribution centers are determined by many factors. Each distribution center has its own unique requirements or priorities." [Order processing. Wikipedia]
The vertical cross-functional flow chart example "Order processing" was created using the ConceptDraw PRO diagramming and vector drawing software extended with the Flowcharts solution from the area "What is a Diagram" of ConceptDraw Solution Park.
The vertical cross-functional flow chart example "Order processing" was created using the ConceptDraw PRO diagramming and vector drawing software extended with the Flowcharts solution from the area "What is a Diagram" of ConceptDraw Solution Park.
Cross-functional flowchart
Contoh Flowchart

EPC Diagrams Illustrate Business Process Work Flows

Processing Flow Chart

ConceptDraw DIAGRAM enhanced with Flowcharts Solution from the "Diagrams" Area of ConceptDraw Solution Park is a powerful Processing Flow Chart software which will help save lots of your time.
How to Create a Cross Functional Flow Chart

Ordering Process Flowchart. Flowchart Examples

Credit Card Order Process Flowchart. Flowchart Examples

EPC for Business Process Improvement

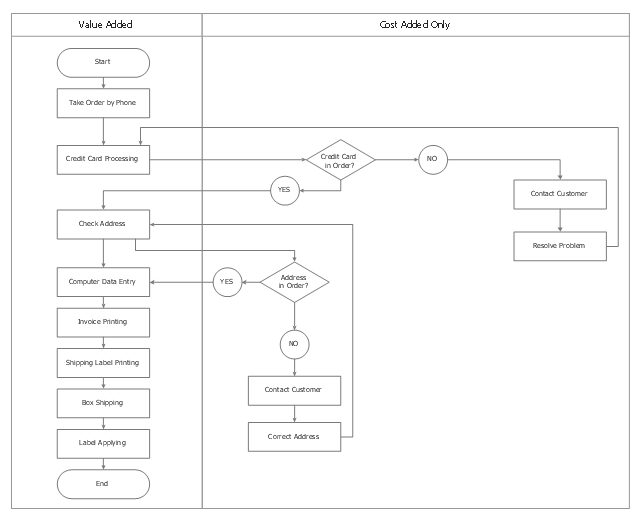
This cross-functional flowchart sample shows the order processing flow.
"Opportunity flowcharts are a variation of detailed basic flowcharts. They get their name because they highlight opportunities for improvement. Like all flowcharts, they make the process visible. But they take this idea one step further by separating value-added steps (those essential for making the product or service) from cost-added-only steps (those that are included only to check for or fix problems). ...
An opportunity flowchart is created by rearranging a detailed basic flowchart. The steps needed if everything works perfectly should flow down the left side of the chart. Steps that exist because of problems and inefficiencies flow across the right side." [Flowcharts: Plain & Simple. Inc Staff Joiner Assocs. 1995. P. 60.]
The swim lane diagram example "Process flowchart - Order processing" was created using the ConceptDraw PRO diagramming and vector drawing software extended with the Process Flowcharts solution from the Business Processes area of ConceptDraw Solution Park.
Swim lane diagram
Example Process Flow Chart

Work Order Process Flowchart. Business Process Mapping Examples

 Flowcharts
The Flowcharts solution for ConceptDraw DIAGRAM is a comprehensive set of examples and samples in several varied color themes for professionals that need to represent graphically a process. Solution value is added by the basic flow chart template and shapes' libraries of flowchart notation. ConceptDraw DIAGRAM flow chart creator lets one depict the processes of any complexity and length, as well as design the Flowchart either vertically or horizontally.
 Cross-Functional Flowcharts
Cross-functional flowcharts are powerful and useful tool for visualizing and analyzing complex business processes which requires involvement of multiple people, teams or even departments. They let clearly represent a sequence of the process steps, the order of operations, relationships between processes and responsible functional units (such as departments or positions).
HelpDesk
How to Create a Cross-Functional Flowchart

Cross-Functional Process Map Template

Flowchart Definition

 Event-driven Process Chain Diagrams
Event-Driven Process Chain Diagrams solution extends ConceptDraw DIAGRAM functionality with event driven process chain templates, samples of EPC engineering and modeling the business processes, and a vector shape library for drawing the EPC diagrams and EPC flowcharts of any complexity. It is one of EPC IT solutions that assist the marketing experts, business specialists, engineers, educators and researchers in resources planning and improving the business processes using the EPC flowchart or EPC diagram. Use the EPC solutions tools to construct the chain of events and functions, to illustrate the structure of a business process control flow, to describe people and tasks for execution the business processes, to identify the inefficient businesses processes and measures required to make them efficient.
Basic Flowchart Symbols and Meaning


- Order processing - Cross-functional flowchart | Order processing ...
- Sales Process Flowchart Symbols | Work Order Process Flowchart ...
- Invoice payment process - Flowchart | Purchase order processing ...
- Order processing - Cross-functional flowchart | Order processing ...
- Flowchart Marketing Process . Flowchart Examples | Work Order ...
- Work Order Process Flowchart . Business Process Mapping ...
- Accounting Information Systems Flowchart Symbols | Order ...
- Sales Order Processing Flow Chart With Details
- Order processing center - UML sequence diagram | Order ...
- Process flowchart - Order processing | Taxi order process - BPMN ...
- Order processing - EPC flow chart | Flowchart Of Order System
- Flowchart Sales Order Processing
- Flow process chart | LLNL Flow Charts | Order processing - EPC ...
- Order processing - Cross-functional flowchart | Cross-Functional ...
- Purchase order processing UML activity diagram | Order process ...
- Sales Order Entry Process Flow Chart
- Credit Card Order Process Flowchart . Flowchart Examples ...
- Order processing center - UML sequence diagram | Order process ...
- EPC Diagrams Illustrate Business Process Work Flows | Event ...