Interior Design. Office Layout Plan Design Element
While developing an office layout, it is important to choose a right office space. One should take into account that some layouts are suitable for frequent communication among employees and are inappropriate for a high level of concentration, and vice versa, private offices are not convenient for frequent communication.ConceptDraw Building Drawing Tools - draw simple office layout plans easily with Office Layout Plan Design Element. Use it to draw office interior design floor plans, office furniture and equipment layouts, and blueprints for facilities management, move management, office supply inventories, assets inventories, office space planning.
HelpDesk
How to Create a Picture Graph
Picture Graphs are used commonly to represent non-complex data to a large audience. A Picture Graph is a simple kind of marketing diagram used to show the relationship among various quantities. It includes pictures or symbols to represent information visually. There are many cases when you have just some numbers to show and compare. This is not a reason to not use visual tools. You can produce a simple picture graph using memorable symbols to get the best visual presentation. Using specific symbols instead of regular colored bars makes picture graphs a much more descriptive tool. You can use tools from an existing library or find appropriate clipart in ConceptDraw’s collection. ConceptDraw DIAGRAM allows you to draw a simple and easy to understand Picture Charts using the special library.HelpDesk
What Information to be Displayed in the ConceptDraw PROJECT Gantt Chart View
What information can can contain the project task list? Gantt Chart view is a graphical representation of a project outline that allows one to allocate tasks.You can customize a project’s tasks list view to include the columns you need to meet your information requirements. The columns of the ConceptDraw PROJECT Gantt view contain the information you want to capture about each task in your project. The following article details what information can be contained in the columns of a project outline.HelpDesk
How to Determine what Information to be Displayed in the Project Resource List
After you create a project task list it is a necessary move to resource planning. You need to determine and assign resources to each task. There are several types of resources defined in ConceptDraw PROJECT: work, material, cost, and equipment. The columns of a project Resource List in ConceptDraw PROJECT displays the information you need to capture about each resource in your project.HelpDesk
How to Set a Project Baseline
Project baseline in ConceptDraw PROJECT is excellent forguiding the execution of the current project and can be useful for further projects.HelpDesk
What Information can be Displayed in the Multiproject Dashboard View
The columns in a Multiproject Dashboard tab of ConceptDraw PROJECT determine what information you want to capture on each project. It’s important to make sure you have the correct columns available. This article describes information that multiple projects list can contain.HelpDesk
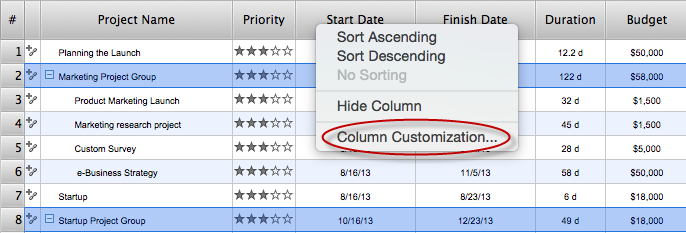
How to Customize Columns in Your Project Schedule
Some ConceptDraw PROJECT users need to start new projects from their custom default page. In this post, we tell you how to make it.HelpDesk
How to Import Project Data From MS Excel File
You can import information into the project from MS Excel workbook using the entered fields - fields in which you can enter or edit information as opposed to calculated fields.HelpDesk
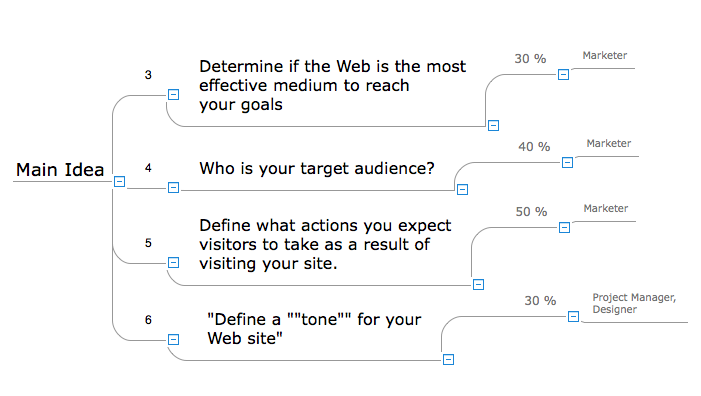
How to Input Data from MS Excel Into a Mind Map
Many people apply Excel documents to store data in the form of hierarchical lists. With ConceptDraw MINDMAP you can easily turn the linear structure of an Excel table in a radial structure of mind map ConceptDraw MINDMAP will create a mind map file (CDMZ) from your Excel (XLS) file. If you keep your information in the Microsoft Excel files, you can import them into ConceptDraw MINDMAP, converting the columns and rows to a hierarchically structured mind map. If you have multiple individual sheets in your Excel workbook, ConceptDraw MINDMAP will turn them into a single multi-page mind map. ConceptDraw MINDMAP lets you import an entire Microsoft® Excel file as well as insert data from the selected cells.How to Draw a Landscape Design Plan
What is landscape design? It's a floor plan but for an outdoor area.
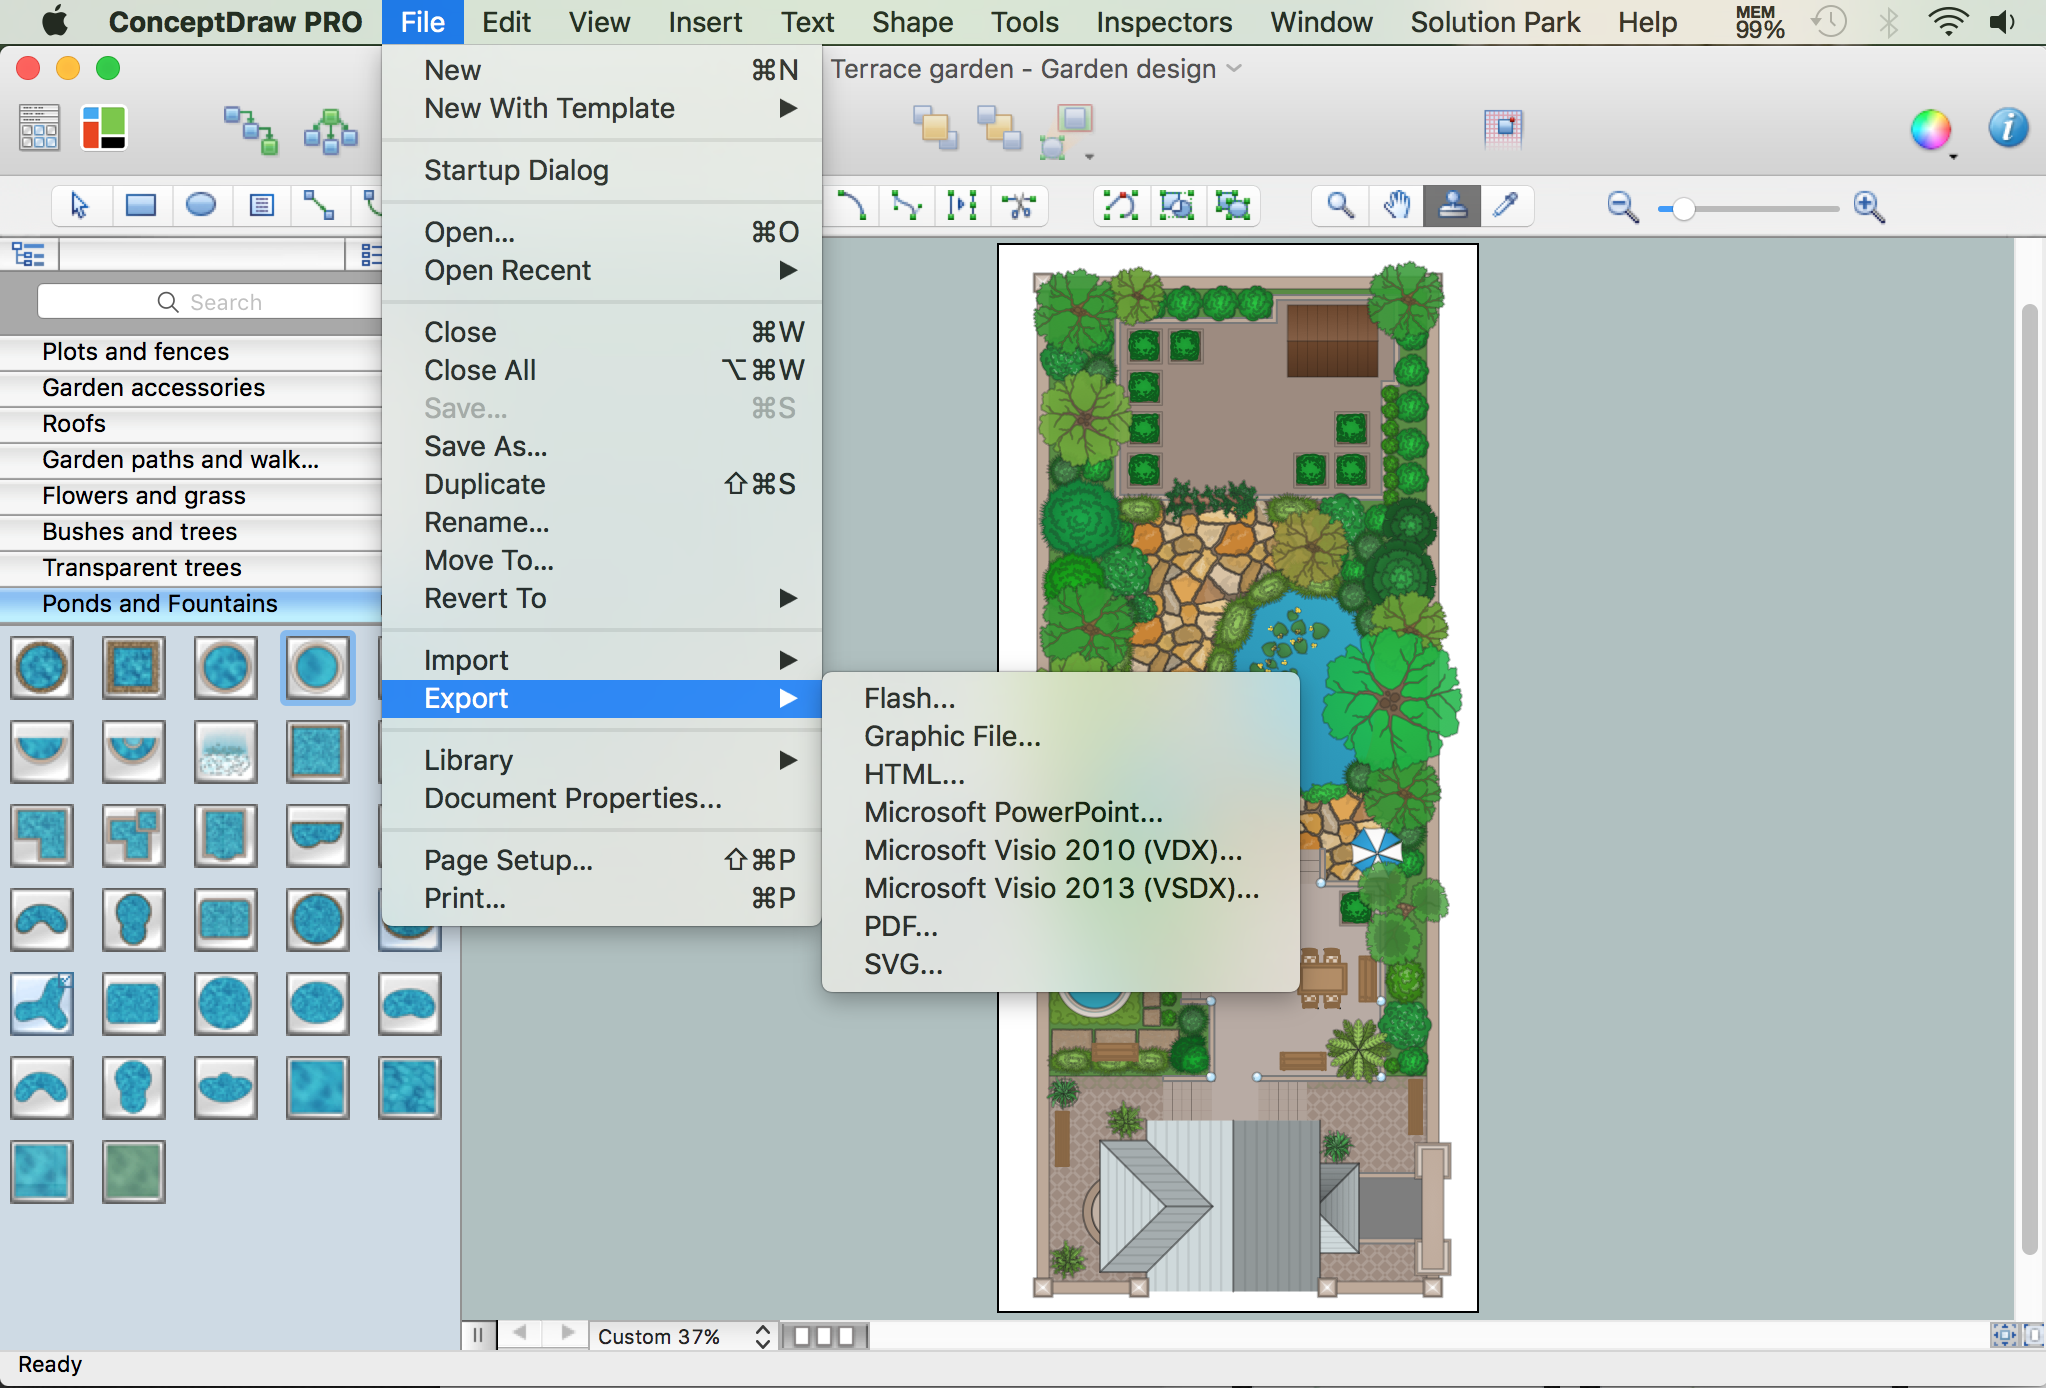
Same as a floor plan, a landscape design represents visually any site using scaled dimensions.
The main purpose of landscape design is to plan the layout for an outdoor area no matter is it a personal site plan for your home or a commercial plan for business. It may also be handful when a new installation, repair or even an outdoor event is planning.
It helps to calculate time and decide which materials should be used in your project. Landscape designs perfectly gives the property owner and landscape contractor better vision for cost estimation, helping to ensure the project time and budget.
HelpDesk
How to Create a Custom Filter in ConceptDraw PROJECT for Windows
With ConceptDraw PROJECT, you can filter project data so that you only see the information that’s most important to you.HelpDesk
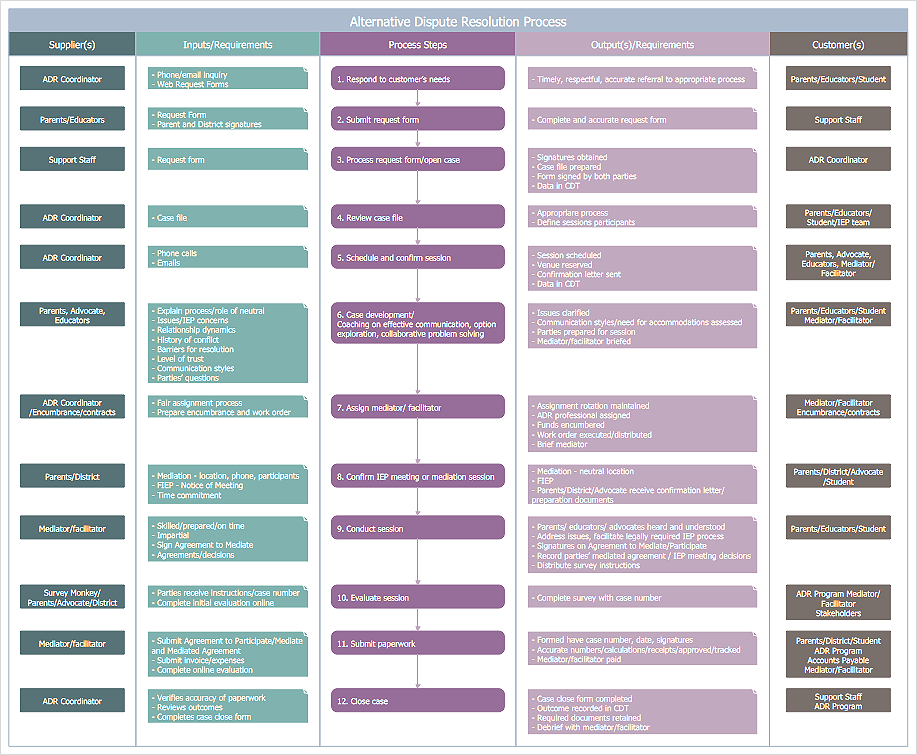
How to Create a SIPOC Diagram
SIPOC (suppliers, inputs, process, outputs, customers) diagram is focused on the quality of a business process inputs and outputs. SIPOC diagram has a form of a segmented table that gives a comprehensive outline for each category. SIPOC diagram depicts the start and end of a process and the relationships between a company and its suppliers. SIPOC diagram is an important part of the Six Sigma methodology. With its Business Process Mapping solution, ConceptDraw DIAGRAM offers a powerful set of process mapping tools to empower quality management within an organization.HelpDesk
How to Draw a Histogram
Histogram is a diagram used to visualize data through bars of variable heights. Making histogram can be helpful if you need to show data covering various periods (hours, days, weeks, etc). When the vertical column of the histogram refer to frequency it shows how many times any event happens. It is a Frequency histogram. A bar chart diagram is similar to a histogram, but in contrast to a bar chart a histogram represents the number how many times there have been certain data values. You can use a histogram to depict continual data flow such as temperature, time, etc. You can effortlessly draw histograms using the Histograms solution for CnceptDraw DIAGRAM. Making a histogram can by very useful to represent various statistical data.Website Wireframe
The innovative Website Wireframe solution enhances the ConceptDraw DIAGRAM functionality with newest wireframe tools, libraries with variety of predesigned icons, symbols, buttons, graphics, forms, boxes, and many other vector elements, templates and professionally designed samples, which make it the best wireframing software. Website Wireframe solution gives you significant advantages when designing and maintaining websites, creating skeletal and content-free depictions of website structure, making website prototypes and planning the content arrangement before committing to design, also speeds up the processes of sketching, producing and sharing wireframe examples of website style and interface design.
Histograms
How to make a Histogram? Making a Histogram is an incredibly easy process when it is done with ConceptDraw DIAGRAM. The Histograms Solution enhances ConceptDraw DIAGRAM functionality with extensive drawing tools, numerous samples, and examples; also a quick-start template and library of ready vector stencils for visualization the data and professional drawing Histograms.
- Interior Design Office Layout Plan Design Element
- Interior Design Office Layout Plan Design Element | Design ...
- Building Drawing Software for Design Office Layout Plan | Cisco ...
- Interior Design Office Layout Plan Design Element | Interior Design ...
- Building Drawing Software for Design Office Layout Plan | Interior ...
- Ceiling Ideas For Living Room | Ceiling Design Ideas | Reflected ...
- How To Draw Building Plans
- How To Draw Building Plans | Building Drawing Software for Design ...
- Building Drawing Software for Design Office Layout Plan | Process ...
- Design elements - Walls, shell and structure | Office Design Software ...
- Living Room . Piano in plan | Building Drawing Software for Design ...
- How To Draw Building Plans | Piping and Instrumentation Diagram ...
- Building Drawing Software for Design Office Layout Plan | Design ...
- How To use House Electrical Plan Software | Cafe electrical floor ...
- Interior Design Office Layout Plan Design Element | Building ...
- CAD Drawing Software for Making Mechanic Diagram and Electrical ...
- Office Layout Plans | Room planning with ConceptDraw PRO | Floor ...
- How To Create Restaurant Floor Plan in Minutes | Building Drawing ...
- CAD Drawing Software for Making Mechanic Diagram and Electrical ...
- Home floor plan template | Doors - Vector stencils library | Room ...
- ERD | Entity Relationship Diagrams, ERD Software for Mac and Win
- Flowchart | Basic Flowchart Symbols and Meaning
- Flowchart | Flowchart Design - Symbols, Shapes, Stencils and Icons
- Flowchart | Flow Chart Symbols
- Electrical | Electrical Drawing - Wiring and Circuits Schematics
- Flowchart | Common Flowchart Symbols