How to Report Task's Execution with Gantt Chart

Gantt Chart Software

What is Gantt Chart (historical reference)

Advanced printing in ConceptDraw PROJECT

Business diagrams & Org Charts with ConceptDraw DIAGRAM


Flow Chart Symbols

HelpDesk
How to Draw a Gantt Chart

How To Plan and Implement Projects Faster

Computer Hardware - Reseller Business Plan

HelpDesk
How to Create Project Diagrams on PC

HelpDesk
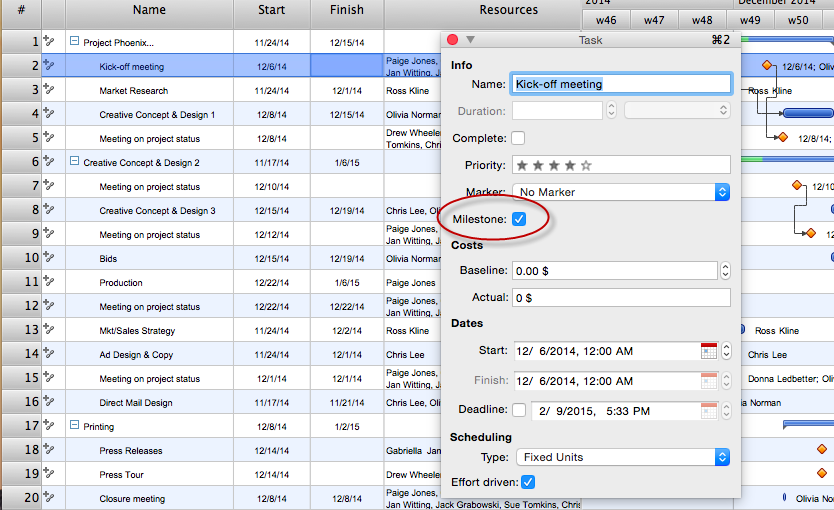
How to Identify Project Milestones
Timeline Examples

Examples of Flowcharts, Org Charts and More


HelpDesk
How to Generate Tabular Reports in ConceptDraw PROJECT for Windows

Samples of Flowchart

- How to Report Task's Execution with Gantt Chart | How to Make a ...
- How to Report Task's Execution with Gantt Chart | PM Easy | How to ...
- Gantt chart examples | Basic Flowchart Symbols and Meaning ...
- Milestone Project Management Example
- How to Make a Timeline | Design elements - Timelines and ...
- How to Report Task's Execution with Gantt Chart | How to Create a ...
- Milestone Symbol
- Milestone Chart Template
- Gantt chart examples | IDEF0 Flowchart Symbols | UML Class ...
- Basic Flowchart Symbols and Meaning | Audit Flowchart Symbols ...
- Timelines and milestones - Vector stencils library | How to Make a ...
- Basic Flowchart Symbols and Meaning | How to Report Task's ...
- Timeline diagram | Basic Flowchart Symbols and Meaning | How To ...
- Milestone Drawing
- How to Identify Project Milestones | How to Report on Project ...
- Timeline Of Project Phases And Milestones
- How to Create a Timeline Diagram in ConceptDraw PRO | Project ...
- How to Create a Timeline Diagram in ConceptDraw PRO | Project ...
- Milestone Icon Vector
- Basic Flowchart Symbols and Meaning | Gant Chart in Project ...
- ERD | Entity Relationship Diagrams, ERD Software for Mac and Win
- Flowchart | Basic Flowchart Symbols and Meaning
- Flowchart | Flowchart Design - Symbols, Shapes, Stencils and Icons
- Flowchart | Flow Chart Symbols
- Electrical | Electrical Drawing - Wiring and Circuits Schematics
- Flowchart | Common Flowchart Symbols
- Flowchart | Common Flowchart Symbols