 Entity-Relationship Diagram (ERD)
An Entity-Relationship Diagram (ERD) is a visual presentation of entities and relationships. That type of diagrams is often used in the semi-structured or unstructured data in databases and information systems. At first glance ERD is similar to a flowch
 Entity-Relationship Diagram (ERD)
Entity-Relationship Diagram (ERD) solution extends ConceptDraw DIAGRAM software with templates, samples and libraries of vector stencils from drawing the ER-diagrams by Chen's and crow’s foot notations.
Block Diagram Software

Process Flow Chart Symbol

The mostly used set of process flow chart symbols includes the following: Rectangle (box) process flow chart symbol, Rounded rectangle, Circle, Diamond.
SSADM Diagram

The example below illustrates the waterfall model used in SSADM. This model involves 5 stages of developing a product such as requirements specification and its' analysis, design, coding and testing.
Property Management Examples

This sample shows the Property Management matrix, the ideas are ordered in regards to importance and frequency. This matrix gives the ability to turn the theory into quantifiable data.
Business Process Mapping — How to Map a Work Process

Video tutorials on ConceptDraw products. Try it today!
How to Build Cloud Computing Diagram Principal Cloud Manufacturing

For documenting the Cloud Computing Architecture with a goal to facilitate the communication between stakeholders are successfully used the Cloud Computing Architecture diagrams. It is convenient and easy to draw various Cloud Computing Architecture diagrams in ConceptDraw DIAGRAM software with help of tools of the Cloud Computing Diagrams Solution from the Computer and Networks Area of ConceptDraw Solution Park.
Technical Drawing Software

ConceptDraw DIAGRAM extended with: Mechanical Engineering Solution, Electrical Engineering Solution, Chemical and Process Engineering Solution from the Industrial Engineering Area is powerful software for business and technical drawing. Its powerful drawing tools, predesigned vector objects, templates, samples are helpful for creation all kinds of Technical Drawings and Technical Diagrams, Electrical and Mechanical Schematics, Circuit and Wiring Diagrams, Structural Drawings, and many other.
Visualize Stakeholder Analysis

Use the ConceptDraw DIAGRAM diagramming and vector drawing software enhanced with powerful tools of Stakeholder Onion Diagrams Solution from the Management Area of ConceptDraw Solution Park to easy and effectively visualize stakeholder analysis.
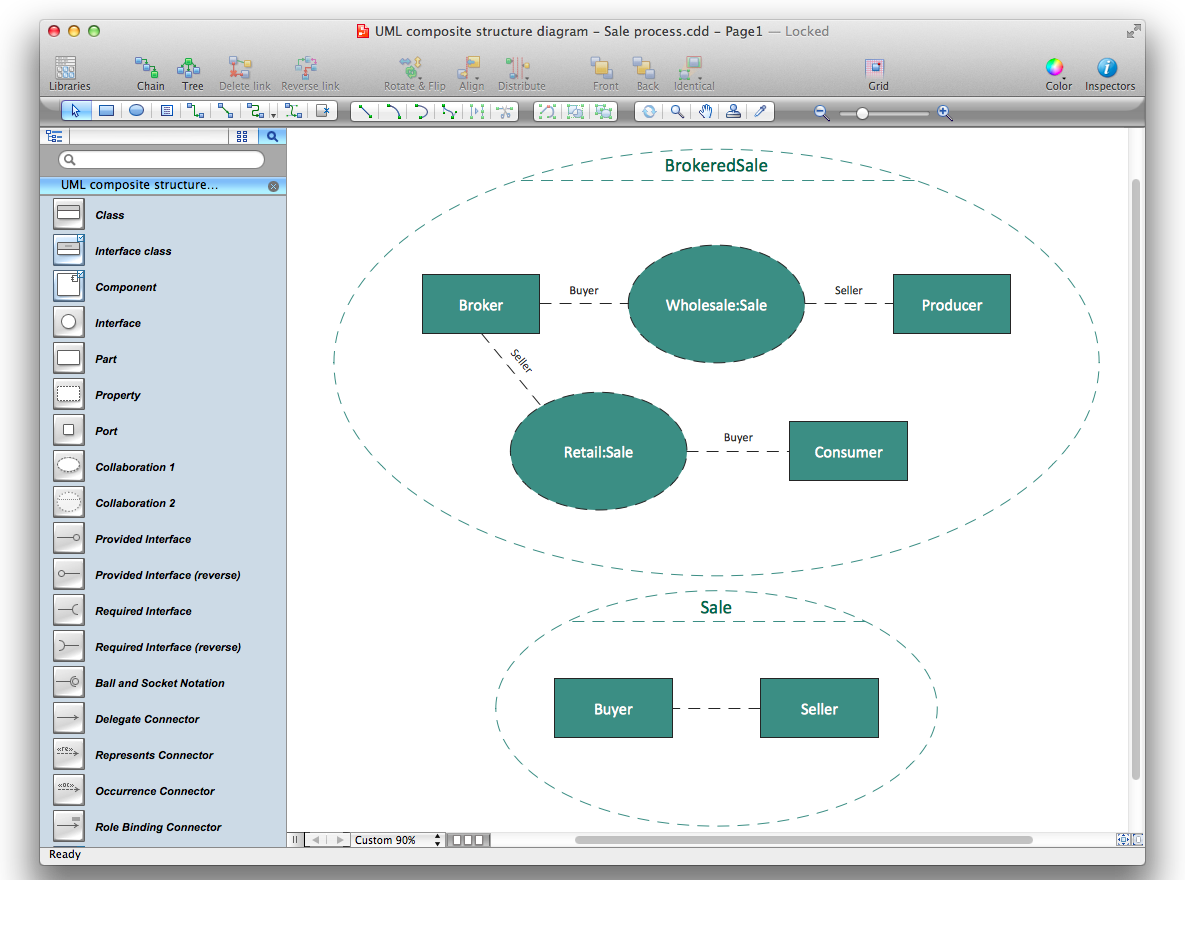
Diagramming Software for UML Composite Structure Diagrams

Professional Diagram and Flowchart Software

Stakeholder Management System

ConceptDraw DIAGRAM is a powerful diagramming and vector drawing software. Now, thanks to the Stakeholder Onion Diagrams Solution included to the Management Area of ConceptDraw Solution Park, ConceptDraw DIAGRAM became also unique stakeholder management system design software.
UML Use Case Diagram Example. Social Networking Sites Project

This sample shows the Facebook Socio-health system and is used at the projection and creating of the social networking sites.
Network Visualization with ConceptDraw DIAGRAM

- Er Diagram For Hr Management System
- Er Diagram For Human Resource Management System
- Human Resource Management Entity Relationship Diagram
- Er Diagram Of Hr Management System
- Entity Relationship Diagram Symbols | HR Management Software ...
- Erd Example For Document Management System
- Draw Er Diagram Of Payroll Management System In Ms Access
- Er Diagram For Empoyee Recruitment System
- Er Diagram For Recruitment Management System
- Identifying Quality Management System | HR Management Software ...
- Er Diagram Of Employee Management System
- Er Diagram For Property Management System
- HR Management Software | Entity Relationship Diagram Symbols ...
- Inventory Management System Er Diagram
- Er Diagram For Employee Recruitment System
- Draw The ER Diagram To Employee Management System Using
- Entity Relationship Diagram Symbols | HR Management Software ...
- ER Diagram For Human Resource Management System In Banking
- Draw Er Diagram Of Employee Management System
- Er Diagram For Employee Management System
- ERD | Entity Relationship Diagrams, ERD Software for Mac and Win
- Flowchart | Basic Flowchart Symbols and Meaning
- Flowchart | Flowchart Design - Symbols, Shapes, Stencils and Icons
- Flowchart | Flow Chart Symbols
- Electrical | Electrical Drawing - Wiring and Circuits Schematics
- Flowchart | Common Flowchart Symbols
- Flowchart | Common Flowchart Symbols