Visualization Spatial Data Using Thematic Maps Combined with Infographics

Nice and simple, but the features it have are power-packed!
Process Flowchart


Tools to Create Your Own Infographics

HelpDesk
How to Use the MS Word Exchange Solution

Excellent Examples of Infographic Maps

HelpDesk
How to Start Mind Mapping from a Custom Template


Map Infographic Creator

Geospatial Data

Create a Presentation Using a Design Template

An advanced tool allows you effectively generate, change, and update your presentation.
Map Infographic Tool

Map Infographic Maker

Mind Map - Quality Structure

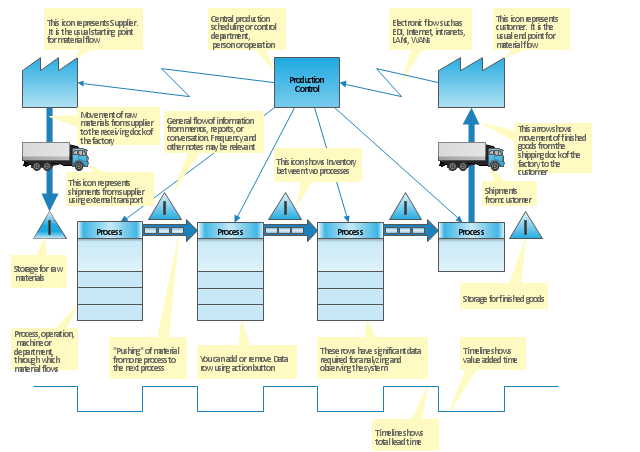
"Value stream mapping is a lean management principle used to analyze and design the flow of materials and information required to bring a product or service to a consumer. Pioneered by Henry Ford in the 1920s, perfected by Toyota. At Toyota, it is known as "material and information flow mapping". It can be applied to nearly any value chain. ...
Value stream mapping has supporting methods that are often used in Lean environments to analyze and design flows at the system level (across multiple processes).
Although value stream mapping is often associated with manufacturing, it is also used in logistics, supply chain, service related industries, healthcare, software development, product development, and administrative and office processes." [Value stream mapping. Wikipedia]
This value stream map template explains the meanings of the VSM design elements.
This Value stream map template for the ConceptDraw PRO diagramming and vector drawing software is included in the Value Stream Mapping solution from the Quality area of ConceptDraw Solution Park.
VSM template
Quality Mind Maps - samples and templates

Map Infographic Design

- Location Map Template
- Data Mapping Template Excel
- Statistics Map Template
- Visualization Spatial Data Using Thematic Maps Combined with ...
- Languages of South America - Thematic map | Europe thematic map ...
- Map Infographic Creator | Spatial infographics Design Elements ...
- Value Stream Mapping Template | Spatial infographics Design ...
- Usa Map Template
- Mind Map - Quality Structure | How to exchange data files of major ...
- 2D Directional map - Template | Directional Maps | Map Directions ...
- Professional Mind Map Template
- Map Infographic Creator | Spatial infographics Design Elements ...
- Visualization Spatial Data Using Thematic Maps Combined with ...
- Excel Template Online Strategy Map
- Map Infographic Creator | Visualization Spatial Data Using Thematic ...
- Data Visualization Software Solutions | Data Visualization Solutions ...
- Reporting & Data Visualization | Data Visualization Software ...
- Value Stream Mapping Template | How to Start Mind Mapping from ...
- Mind Map Making Software | One formula of professional mind ...
- Spatial infographics Design Elements: Continental Map | How to ...
- ERD | Entity Relationship Diagrams, ERD Software for Mac and Win
- Flowchart | Basic Flowchart Symbols and Meaning
- Flowchart | Flowchart Design - Symbols, Shapes, Stencils and Icons
- Flowchart | Flow Chart Symbols
- Electrical | Electrical Drawing - Wiring and Circuits Schematics
- Flowchart | Common Flowchart Symbols
- Flowchart | Common Flowchart Symbols