Flowchart Symbols Accounting. Activity-based costing (ABC) flowchart

What process should be essentially adopted. Accounting Flowchart Example

How well does Your Purchase Process Flow?

Activity Network Diagram Method

This sample shows the PERT (Program Evaluation Review Technique) chart of the request on proposal. A request for proposal (RFP) is a request of the company or the organization to potential suppliers to submit the business proposals for service or goods that it is interested to purchase. The RFP is represented on the initial procurement stage and allows to define the risks and benefits.
Linux Audit Flowchart Example. Flowchart Examples

This flowchart example describing auditd, the linux audit tool.
Pyramid Diagram and Pyramid Chart

ConceptDraw DIAGRAM Compatibility with MS Visio

Is ConceptDraw DIAGRAM an Alternative to Microsoft Visio?

HelpDesk
How to Create an Accounting Flowchart

"In elementary algebra, a quadratic equation (from the Latin quadratus for "square") is any equation having the form
ax^2+bx+c=0
where x represents an unknown, and a, b, and c are constants with a not equal to 0. If a = 0, then the equation is linear, not quadratic. The constants a, b, and c are called, respectively, the quadratic coefficient, the linear coefficient and the constant or free term.
Because the quadratic equation involves only one unknown, it is called "univariate". The quadratic equation only contains powers of x that are non-negative integers, and therefore it is a polynomial equation, and in particular it is a second degree polynomial equation since the greatest power is two.
Quadratic equations can be solved by a process known in American English as factoring and in other varieties of English as factorising, by completing the square, by using the quadratic formula, or by graphing." [Quadratic equation. Wikipedia]
The flowchart example "Solving quadratic equation algorithm" was created using the ConceptDraw PRO diagramming and vector drawing software extended with the Mathematics solution from the Science and Education area of ConceptDraw Solution Park.
Solving quadratic equation flow chart

Geo Map — South America Continent
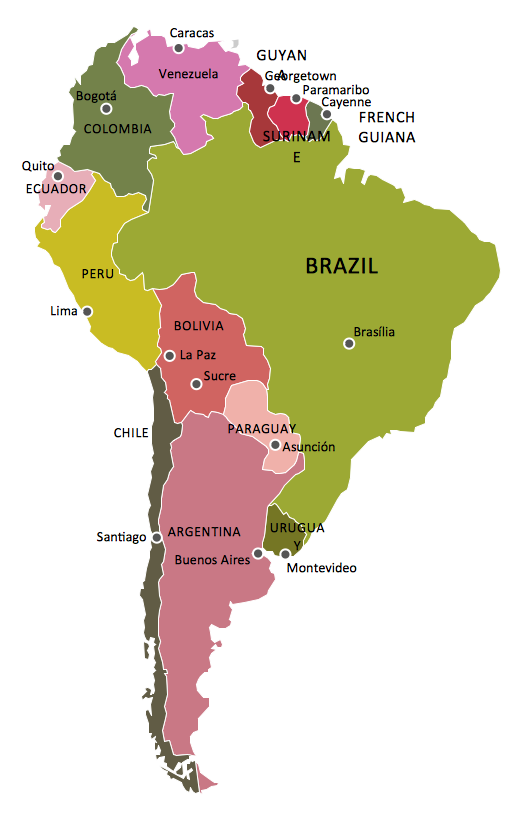
ConceptDraw DIAGRAM is idea to draw the geological maps of South America continent from the pre-designed vector geo map shapes.
Use Continent Maps solution from the Maps area of ConceptDraw Solution Park to draw thematic maps, geospatial infographics and vector illustrations for your business documents, presentations and websites.
 Entity-Relationship Diagram (ERD)
Entity-Relationship Diagram (ERD) solution extends ConceptDraw DIAGRAM software with templates, samples and libraries of vector stencils from drawing the ER-diagrams by Chen's and crow’s foot notations.
 Artwork
Artwork solution extends ConceptDraw DIAGRAM software with illustration samples, templates and libraries of vector clipart of architecture, food, music, funny animals, aquatic fauna and transport.
The vector stencils library "Education pictograms" contains 128 education pictograms. Use this flat icon set to design your educational infogram in ConceptDraw PRO diagramming and vector drawing software.
The vector stencils library "Education pictograms" is included in the Education Infographics solution from the Business Infographics area of ConceptDraw Solution Park.
The vector stencils library "Education pictograms" is included in the Education Infographics solution from the Business Infographics area of ConceptDraw Solution Park.
ABC
Apple

Artist oil colors

Artists paint palette
Atom

Baseball
Basketball

Beaker

Bell

Bicycle

Book - open

Books

Brushes

Bunsen burner

Calculator

Calendar

CD

Cell model

Chemical flask

Cloud

Colored paper
Colored pencils

Compass

Compasses

Dinosaur skeleton

Diploma

DNA double helix

Drop

Dumbbells

Earth

Earth's internal structure

Easel

Email

Eraser

Exercise book

Felt tip pens

Folders

Football

Funnel

Gears

Globe

Gouache

Graduation cap

Grand piano

Grand piano - clipart
Green blackboard

Hourglass

Laptop

Laptop mouse

Light bulb

Magnet

Magnifier

Marker - black

Marker - blue

Marker - green

Marker - red

Marker - white

Marker - yellow

Medal with ribbon

Metronome

Microscope

Moon

Music notes
Notebook

Notepad

Paper clips

Paper sheet

Paper sheet - grid

Paper sheet - lined

Paper stickers

Parthenon

Pen

Pen - fountain

Pencil

Periodic table
Protractor
Push pins

Robot

Round bottom flask

Rugby ball

Ruler

Scales

School backpack

School bus

School satchel

Schoolboy - african

Schoolboy - asian

Schoolboy - caucasian

Schoolboy - indian

Schoolgirl - african

Schoolgirl - asian

Schoolgirl - caucasian

Schoolgirl - indian

Scissors and a bottle of glue

Scroll

Snowflake

Sport cup

Star

Stickers
Stopwatch

Sun

Tablet computer

Teacher with a pointer

Teacher - african

Teacher - asian

Teacher - caucasian

Teacher - indian

Teacher - woman, african

Teacher - woman, asian

Teacher - woman, caucasian

Teacher - woman, indian

Telescope

Test tube

Thermometer

To-Do list

Tree leaf - acacia

Tree leaf - birch

Tree leaf - chestnut

Tree leaf - maple

Tree leaf - oak

Tree leaf - walnut

Triangle ruler
Volleyball

Violin
Violin - clipart

Wall clock

Watercolor set
World map

- Abc Corporate Flow Chart
- Flowchart Symbols Accounting. Activity-based costing ( ABC ...
- Flowchart Symbols Accounting. Activity-based costing ( ABC ...
- Flowchart Symbols Accounting. Activity-based costing ( ABC ...
- Flowchart Symbols Accounting. Activity-based costing ( ABC ...
- Flowchart Symbols Accounting. Activity-based costing ( ABC ...
- Process Flowchart | Flowchart Symbols Accounting. Activity-based ...
- Basic Flowchart Symbols and Meaning | Audit Flowchart Symbols ...
- Process Flowchart | Pyramid Diagram | Flowchart Symbols ...
- Business Processes | Flowchart Symbols Accounting. Activity-based ...
- Process Flowchart | Basic Flowchart Examples | Flowchart Symbols ...
- Flowchart Symbols Accounting. Activity-based costing ( ABC ...
- Flowchart Symbols Accounting. Activity-based costing ( ABC ...
- Accounting Flowchart Symbols | Basic Flowchart Symbols and ...
- Types of Flowchart - Overview | Flowchart Symbols Accounting ...
- Flowchart Symbols Accounting. Activity-based costing ( ABC ...
- Flowchart Symbols Accounting. Activity-based costing ( ABC ...
- Flowchart Symbols Accounting. Activity-based costing ( ABC )
- Basic Flowchart Symbols and Meaning | Workflow to Make a ...
- Flowchart Symbols Accounting. Activity-based costing ( ABC ...
- ERD | Entity Relationship Diagrams, ERD Software for Mac and Win
- Flowchart | Basic Flowchart Symbols and Meaning
- Flowchart | Flowchart Design - Symbols, Shapes, Stencils and Icons
- Flowchart | Flow Chart Symbols
- Electrical | Electrical Drawing - Wiring and Circuits Schematics
- Flowchart | Common Flowchart Symbols
- Flowchart | Common Flowchart Symbols