Flowchart Symbols AccountingActivity-based costing (ABC) flowchart
 flowchart")
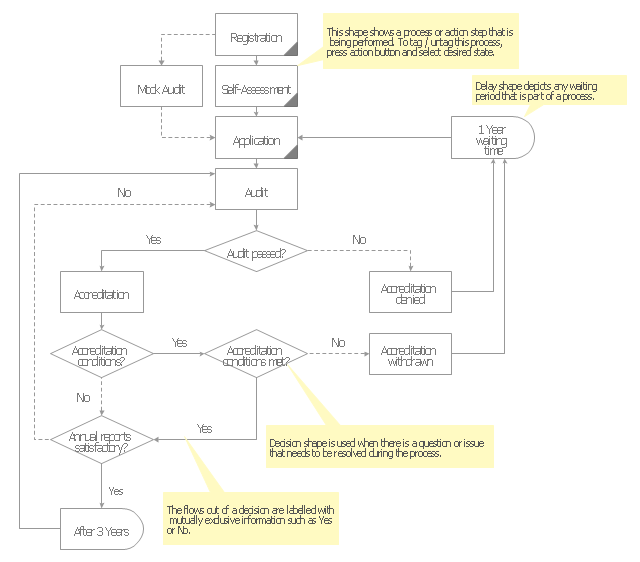
Audit flowcharts (audit diagrams) visualize business processes as financial transactions and inventory management. They are used to develop, analyse and present the audit processes.
"Auditing is a vital part of accounting. Traditionally, audits were mainly associated with gaining information about financial systems and the financial records of a company or a business.
Financial audits are performed to ascertain the validity and reliability of information, as well as to provide an assessment of a system's internal control. The goal of an audit is to express an opinion of the person / organization / system (etc.) in question, under evaluation based on work done on a test basis.
Due to constraints, an audit seeks to provide only reasonable assurance that the statements are free from material error. Hence, statistical sampling is often adopted in audits. In the case of financial audits, a set of financial statements are said to be true and fair when they are free of material misstatements – a concept influenced by both quantitative (numerical) and qualitative factors. But recently, the argument that auditing should go beyond just true and fair is gaining momentum. ...
Cost accounting is a process for verifying the cost of manufacturing or producing of any article, on the basis of accounts measuring the use of material, labor or other items of cost. In simple words, the term, cost audit means a systematic and accurate verification of the cost accounts and records, and checking for adherence to the cost accounting objectives. ...
An audit must adhere to generally accepted standards established by governing bodies. These standards assure third parties or external users that they can rely upon the auditor's opinion on the fairness of financial statements, or other subjects on which the auditor expresses an opinion." [Audit. Wikipedia]
The Audit flowchart template for the ConceptDraw PRO diagramming and vector drawing software is included in the Audit Flowcharts solution from the Finance and Accounting area of ConceptDraw Solution Park.
Audit flowchart template
 Accounting Flowcharts
Accounting Flowcharts solution extends ConceptDraw DIAGRAM software with templates, samples and library of vector stencils for drawing the accounting flow charts.
Value-Stream Mapping for Manufacturing

Decision Making Software For Small Business


Workflow Flowchart Symbols

Flowchart Definition

Create Graphs and Charts

Diagramming Software for Design Business Process Diagrams


Introduction to Cloud Computing Architecture

Why Flowchart Important to Accounting Information System?

Flow chart ExampleWarehouse Flowchart


The vector stencils library "Audit flowcharts" contains 31 symbols of audit flow chart diagrams for accounting, financial management, fiscal information tracking, money management, decision flowcharts, and financial inventories.
"A financial audit, or more accurately, an audit of financial statements, is the verification of the financial statements of a legal entity, with a view to express an audit opinion. The audit opinion is intended to provide reasonable assurance, but not absolute assurance, that the financial statements are presented fairly, in all material respects, and/ or give a true and fair view in accordance with the financial reporting framework. The purpose of an audit is to provide an objective independent examination of the financial statements, which increases the value and credibility of the financial statements produced by management, thus increase user confidence in the financial statement, reduce investor risk and consequently reduce the cost of capital of the preparer of the financial statements. ...
Financial audits are typically performed by firms of practicing accountants who are experts in financial reporting. The financial audit is one of many assurance functions provided by accounting firms. Many organizations separately employ or hire internal auditors, who do not attest to financial reports but focus mainly on the internal controls of the organization. External auditors may choose to place limited reliance on the work of internal auditors. Auditing promotes transparency and accuracy in the financial disclosures made by an organization, therefore would likely to reduce of such corporations to conceal unscrupulous dealings.
Internationally, the International Standards on Auditing (ISA) issued by the International Auditing and Assurance Standards Board (IAASB) is considered as the benchmark for audit process. Almost all jurisdictions require auditors to follow the ISA or a local variation of the ISA." [Financial audit. Wikipedia]
The example "Design elements - Audit flowchart" was created using the ConceptDraw PRO diagramming and vector drawing software extended with the Audit Flowcharts solution from the Finance and Accounting area of ConceptDraw Solution Park.
Audit flowchart symbols

Influence Diagram Software

 Cross-Functional Flowcharts
The Cross-Functional Flowcharts solution extends ConceptDraw DIAGRAM software with cross functional flowchart examples, samples, and libraries of cross functional flow chart vector design elements and CH-1 symbols for easy drawing professional-looking and illustrative Cross Functional Flowchart, Cross Functional Diagram, CH-1 Diagram, Process Flowchart, Deployment Flowchart, Opportunity Flowchart, Swimlane Process Mapping Diagram, or Visio Cross Functional Flowchart for planning and further analyzing, optimizing and improvement processes. The use of included pre-made cross functional flowchart template, opportunity flowchart template, and swimlane process map template, greatly easier designing your Cross-functional flowcharts.
Basic Flowchart Examples

Authority Matrix Diagram Software

Why Flowchart is Important to Accounting Information System?

Create a Cross-Functional Flowchart

- Flowchart Symbols Accounting . Activity-based costing (ABC ...
- Audit flowchart | Accounting Flowcharts | Flow Chart Of Cost Audit
- Audit flowchart - Template | <div> Flowchart Symbols Accounting ...
- Pyramid Diagram | Accounting Flowcharts | Flowchart Symbols ...
- Accounting Flowchart Symbols | Accounting Information Systems ...
- ConceptDraw DIAGRAM Compatibility with MS Visio | Business ...
- Audit Flowchart Symbols | How to Create an Audit Flowchart ...
- Software development with ConceptDraw Products | IDEF4 ...
- Audit flowchart - Template | Audit Flowcharts | Decision Audit Template