This mind map was created in ConceptDraw MINDMAP and it is available as a part of the Quality Mind Map Solution.
This mind map demonstrates how well-known Total Quality Management (TQM) methodology can be represented in a mind map. Using mind mapping for quality management is a creative approach that allows one to structure all key quality points on the one page.
NINE RELATED HOW TO's:
Organizing and Selecting Social Media Response Messages.
Interactive Flowcharts can change the way one creates and organizes their social media response process.
Picture: What is Interactive Flowcharts
Related Solution:
Professional Mind Mapping. ConceptDraw MINDMAP professional software to create documents. Mac and PC compatible. MS Office Exchange Solutions. Skype Collaboration. Presentation Tools.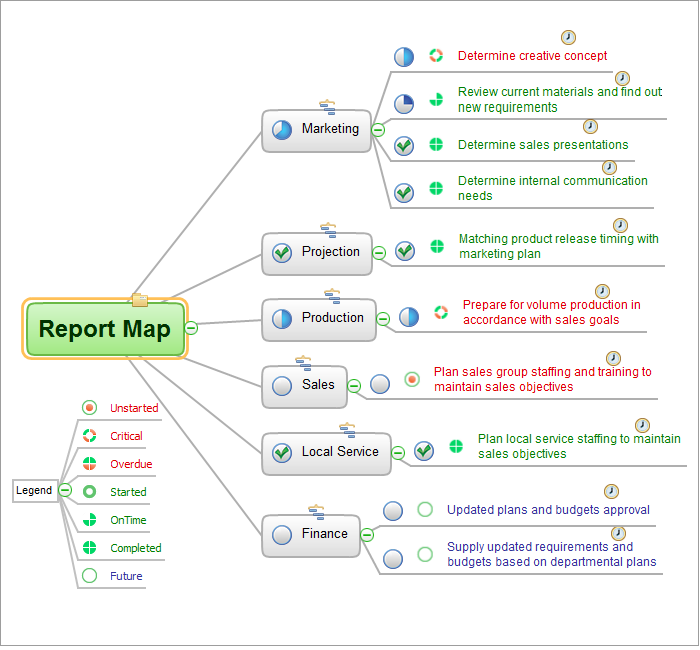
Picture: One formula of professional mind mapping :input data + output data + make great presentation
Related Solution:
To support you in your tasks you can use the power of ConceptDraw DIAGRAM providing
intelligent vector graphics that are useful for management diagramming and
ConceptDraw MINDMAP for key management mind maps.
Picture: Business Productivity - Management
Related Solution:
An organization structure reflects the composition and hierarchy of an organization, determines the distribution of authorities and responsibilities. ConceptDraw DIAGRAM diagramming and vector drawing software extended with 25 Typical Orgcharts solution from the Management area of ConceptDraw Solution Park allows effectively represent the organization structure of the company in the form of Organizational Chart.
Picture: Organization Structure
Related Solution:
You can describe your own quality processes, brainstorm, and structure quality issues; then you can easily and quickly present it to your team.
Quality Management Mind Maps - Presentations, Meeting Agendas, Problem will be solved.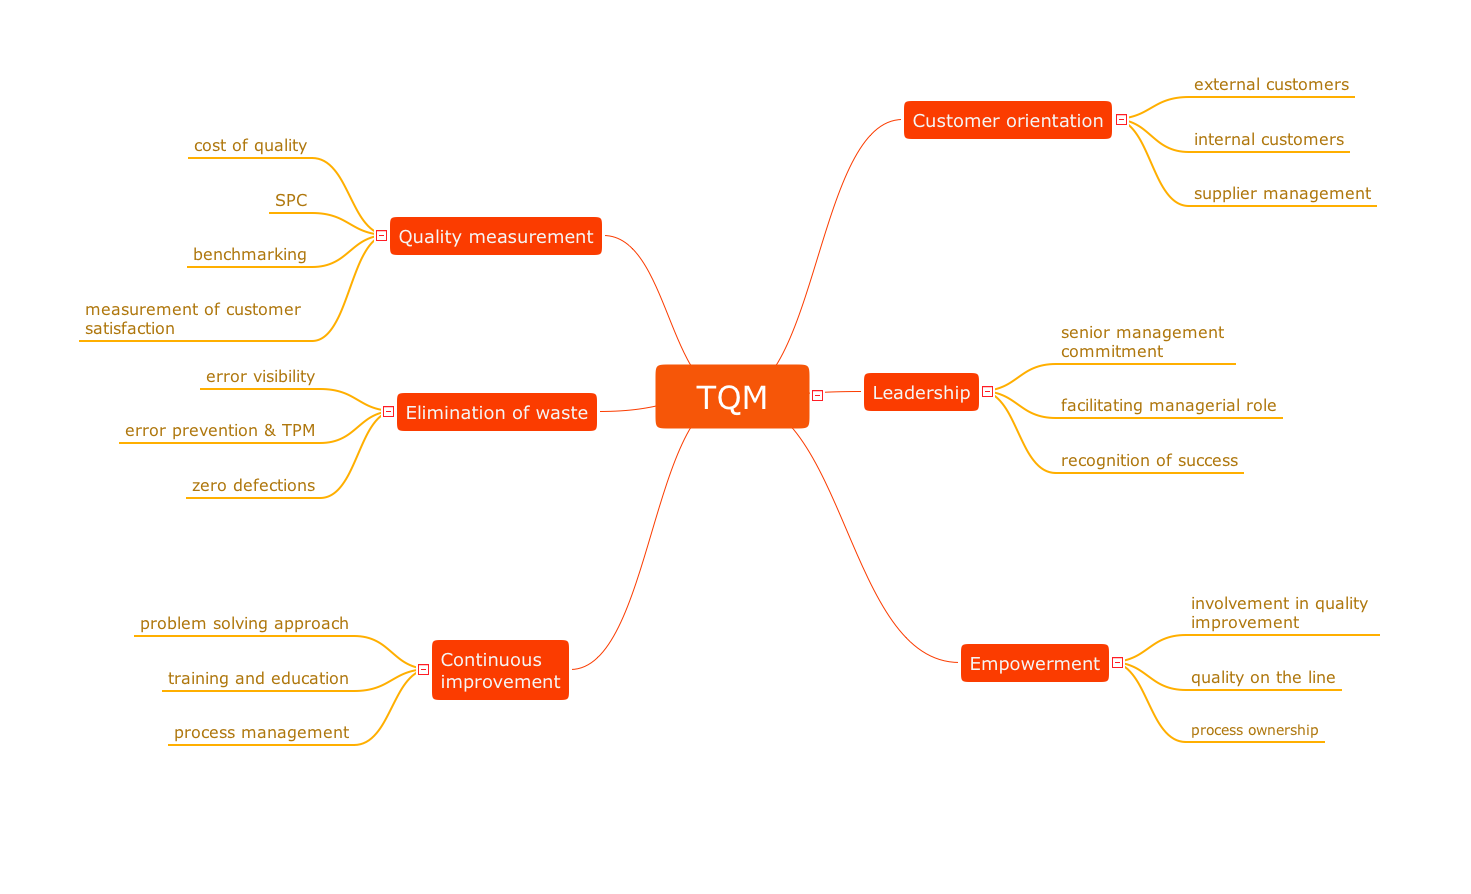
Picture: Why do you need the quality management for the organization
Related Solution:
Total quality management is the one known to be consisting of some organization-wide efforts put in order to install and to make some climate in which this organization can continuously improve its ability to deliver the high-quality products and services to its customers permanently.
Picture: Total Quality Management Definition
Related Solution:
The Time-Money-Quality Triangle illustrates an advertising truism, that you can't have all three.
Picture: Pyramid Diagram
Related Solutions:
A Home Area Networks (HAN) is a type of local area network that is used in an individual home. The home computers can be connected together by twisted pair or by a wireless network. HAN facilitates the communication and interoperability among digital devices at the home, allows to easier access to the entertainments and increase the productivity, organize the home security.
This example was created in ConceptDraw DIAGRAM using the Computer and Networks Area of ConceptDraw Solution Park and shows the home network diagram.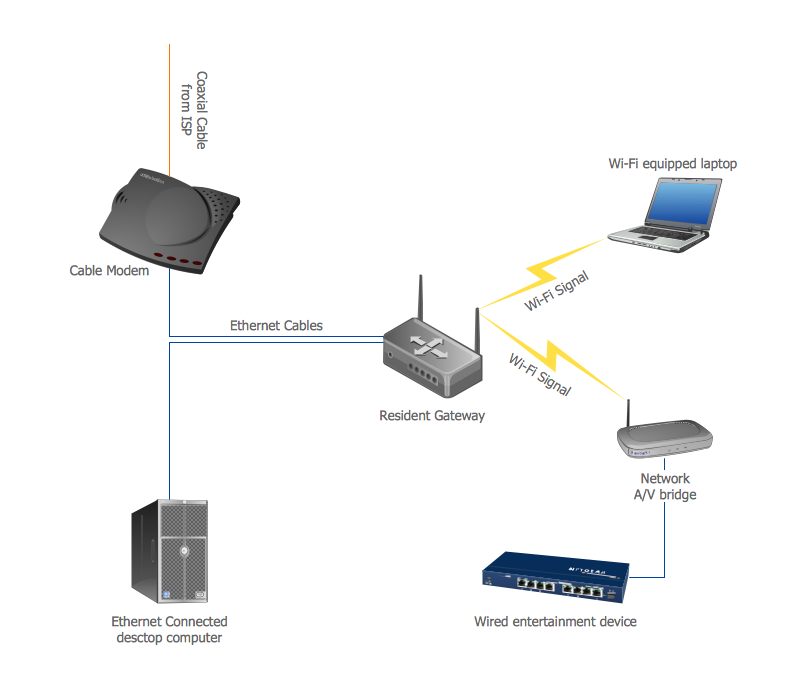
Picture: Home area networks (HAN). Computer and Network Examples
Related Solution:
ConceptDraw the best business process modeling tool to make flow chart diagrams.
Start creating your own flowchart with ConceptDraw DIAGRAM and accomplish great results in the moment. This is the best program to make flow chart diagrams that gives users the ability to simply draw any type of flowchart. The fast creating visualization for the structural data with the vector stencils from object libraries by using RapidDraw technology makes ConceptDraw DIAGRAM the first program in drawing flow data.
Picture: Best Program to Make Flow Chart Diagrams
Related Solution: