Organization Structure
An organization structure reflects the composition and hierarchy of an organization, determines the distribution of authorities and responsibilities. ConceptDraw DIAGRAM diagramming and vector drawing software extended with 25 Typical Orgcharts solution from the Management area of ConceptDraw Solution Park allows effectively represent the organization structure of the company in the form of Organizational Chart.

Example 1. Organization Structure
25 Typical Orgcharts Solution offers a number of tools for effective illustrating the Organization Structure Chart to build then successful business organization.
Two vector shape libraries of 25 Typical Orgcharts Solution will be useful for you. They include all the graphics and icons needed for quick and effective drawing.

Example 2. 25 Typical Orgcharts Solution in ConceptDraw STORE
25 Typical Orgcharts Solution includes also 25 templates and 10 samples specially developed for ConceptDraw DIAGRAM users and available from ConceptDraw STORE.

Example 3. Us Navy Shore Establishment Org Chart
The organization structure samples you see on this page were created in ConceptDraw DIAGRAM software on the base of predesigned templates from 25 Typical Orgcharts Solution for ConceptDraw DIAGRAM Solution Park. An experienced user spent 10 minutes creating each of them.
Use the 25 Typical Orgcharts Solution for ConceptDraw DIAGRAM software for effective organizational management, for fast and easy creation your own professional looking Organizational Structure Charts of any complexity.
All source documents are vector graphic documents. They are available for reviewing, modifying, or converting to a variety of formats (PDF file, MS PowerPoint, MS Visio, and many other graphic formats) from the ConceptDraw STORE. The 25 Typical Orgcharts Solution is available for all ConceptDraw DIAGRAM users.
TEN RELATED HOW TO's:
You are probably familiar with diagrams. But have you ever thought that they are useless? This article will explain you why.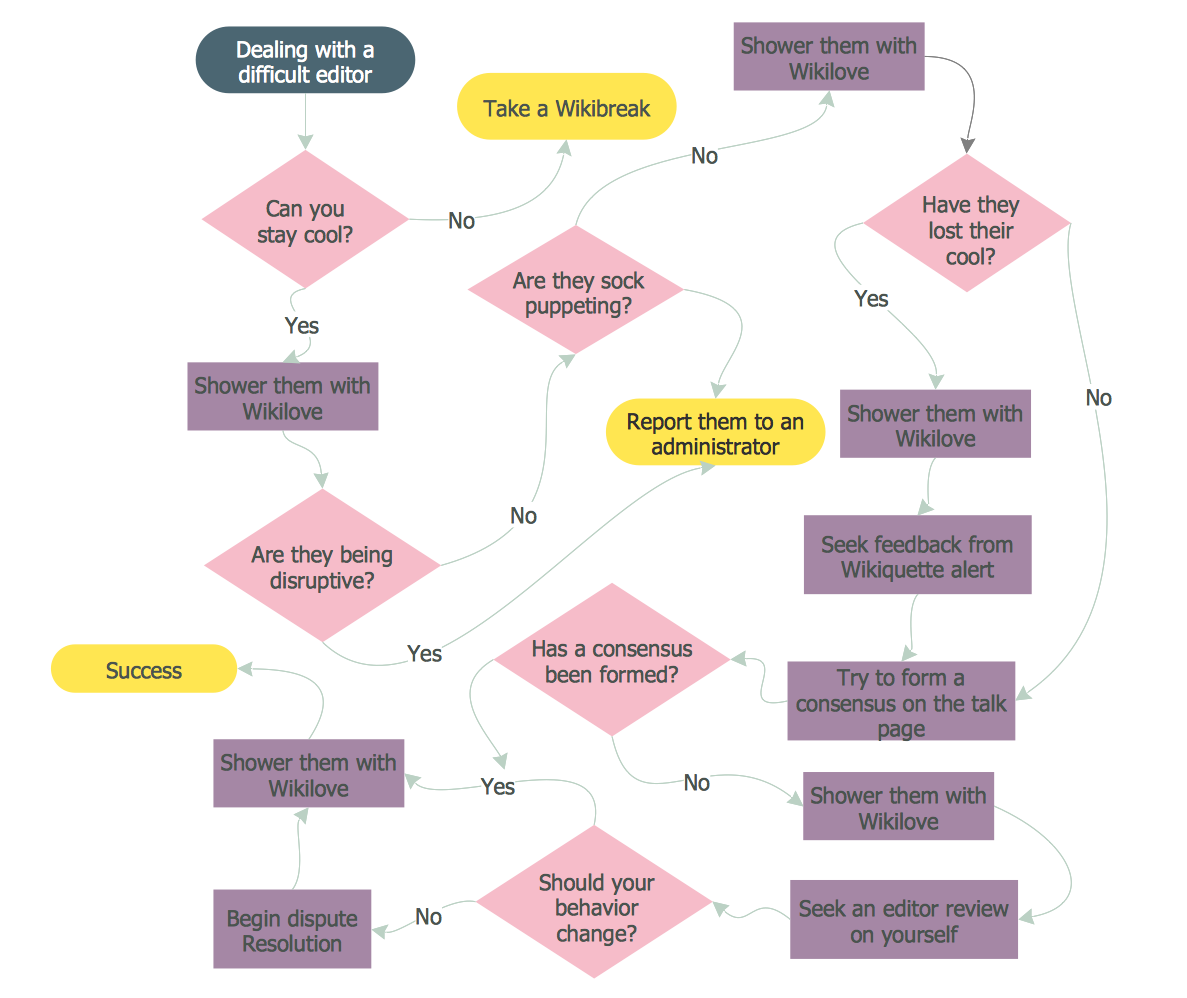
Picture: Diagrams Mean Nothing
Related Solution:
Total quality management is the one known to be consisting of some organization-wide efforts put in order to install and to make some climate in which this organization can continuously improve its ability to deliver the high-quality products and services to its customers permanently.
Picture: Total Quality Management Definition
Related Solution:
Use the advantages of hierarchical tree structure of mind map while developing the organizational structure of your organization. Create an Organizational Chart from your map. Double click the icon to create an Organizational Chart.
The diagram is created automatically from the active page of your map by ConceptDraw DIAGRAM and will be opened in Slideshow mode.
Picture: Organizational Chart
Related Solution:
ConceptDraw Quality MindMap solution is a perfect additional tool for the quality team of your organization.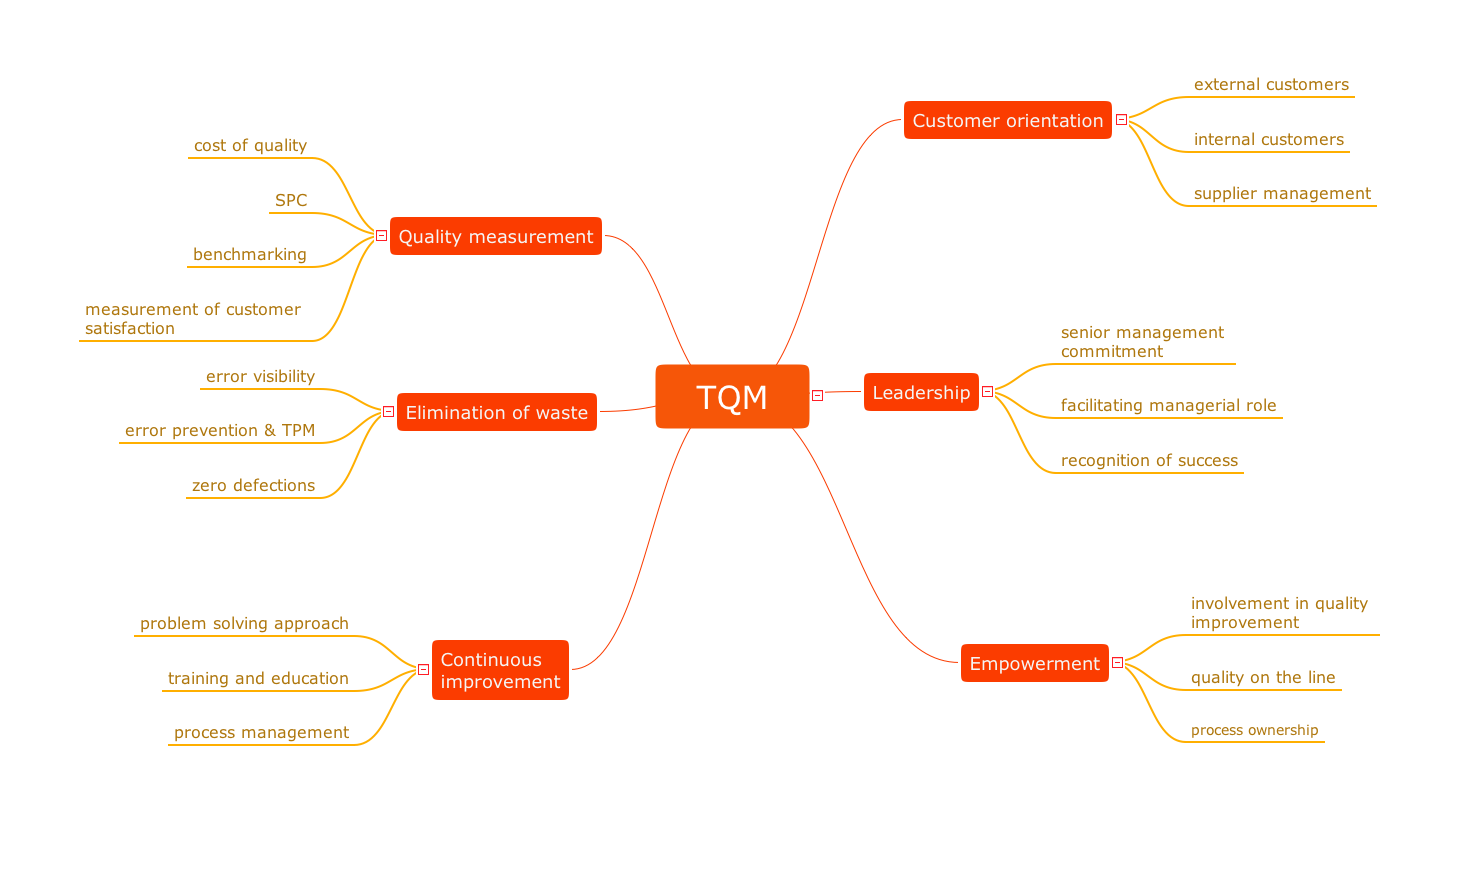
Picture: Quality issues in heir organization
Related Solution:
Social media is a popular view of mass communication which allows people, companies and organizations create, share, discover, modify, access, comment, discuss and exchange information through the Internet. Social Media Response solution for ConceptDraw DIAGRAM provides collection of 10 libraries with diversity of predesigned vector social media flowchart symbols for fast and easy creating interactive Social Media Flowcharts, Response Charts and Action Mind Maps.
Picture: Social Media Flowchart Symbols
Related Solution:
The recruitment process often requires design and use of various HR flowcharts, diagrams, attractive illustrations.
Picture: Recruitment
Related Solution:
Computer networks nowadays are spread all across the world. The large number of parameters, such as geographic scale or communication protocols, can divide networks. One of the most common types of networks is called local area network (LAN). It convenient to represent network examples by means of diagrams.
This local area network (LAN) diagram provides an easy way to see the way the devices in a local network are interacted. The diagram uses a library containing specific symbols to represent network equipment , media and the end-user devices such as computers (PC, mac, laptop) , network printer, hubs, server and finally a modem. There are two types of network topologies: physical and logical. The current diagram represents precisely a physical type of LAN topology because it refers to the physical layout of a local network equipment.
Picture:
What is a Local Area Network?
Examples of LAN Diagrams
Related Solution:
Fishbone Diagram, also referred as Cause and Effect diagram or Ishikawa diagram, is a fault finding and problem solving tool. Construction of Ishikawa diagrams is quite complicated process and has a number of features.
Fishbone Diagrams solution included to ConceptDraw Solution Park contains powerful drawing tools and a lot of examples, samples and templates. Each Fishbone diagram example is carefully thought-out by experts and is perfect source of inspiration for you.
Picture: Fishbone Diagram Example
Related Solution:

 Library")

