Geo Map — USA — Oklahoma
Maps of USA — State of Oklahoma
Oklahoma is one of the states in America having the most quantity of parks, where you can find and visit about 50 of them as well as 6 national ones, protected by the government. 6% of the state's 40000 square kilometres of the forest is public land. This territory includes the oldest as well as the largest national forest in the southern part of the United States of America — the Ouachita National Forest. Oklahoma is known to be the largest protected area of tallgrass prairie in the world, being a part of an ecosystem, encompassing only 10% of its former land area. The “Black Kettle National Grassland” covers 127 square kilometres of prairie in the south-western part of Oklahoma. The Chickasaw National Recreation Area is the largest among the state’s federally protected parks or recreational sites, covering 18 square kilometres.
Oklahoma is known to be located in a humid subtropical region, lying in a transition zone between humid continental climate, semi-arid climate and humid subtropical climate. Most of the state lies in an area called “Tornado Alley”, characterized by frequent interaction between warm to hot, dry air from Mexico, cold, dry air from Canada and warm air from the Gulf of Mexico. The weather in this state can vary widely over relatively short distances; it can change drastically in a short time. There is a humid subtropical climate in the central, eastern and southern parts of Oklahoma, influenced by the southerly winds from the Gulf of Mexico. Although, winter is the driest season in this state. An average monthly precipitation increases dramatically every spring, but every June it is usually still wet, although already in July there is a dry season over most of the territory of this state.
Oklahoma is known to be on the 28th place among the other most populous states in America, having about 3751600 people living there. Although, it takes the 19th place among the largest by land area states, having 177660 square kilometres of it. There are 77 counties all together in this state, containing 597 so-called “incorporated municipalities”, consisting of both small towns and big cities. The cities within the borders of this state have 1000 or more people living there, but the towns are limited to town board type of municipal government. There is the most populous city in the state — Oklahoma, having over 570000 inhabitants taking the first place among the other populous cities of this state. The one, taking the second place, is known to be a city called Tulsa. There are over 390000 people living in Tulsa nowadays. In Norman city there are over 110000 people all together and in the one called Broken Arrow there are up to 100000 inhabitants. On the fifth place there is Lawton with over 95000 people and on the 6th — Edmond, having about 80000 people.
This state takes 27th place among the most agriculturally productive ones in the United States of America and the fifth one in the cattle production as well as in the production of wheat. About 5,5% of beef in America comes from Oklahoma, 6,1% of wheat and 4,2% of pig products. There are, though, only 2,2% of dairy products comes from this state to cover the internal needs. There are about 85500 farms in Oklahoma, producing 4 billion USD in animal products. Swine and poultry are its 2nd and 3rd largest agricultural industries.
Oklahoma is also the 3rd-largest producer of natural gas and 5th largest producer of crude oil. It has the 2nd-greatest number of active drilling rigs and 5th in crude oil reserves. This state is ranked 8th for the installed wind energy, generating about 94% electricity using the non-renewable sources in 2009: 25% from coal and 46% from natural gas. Oklahoma has no nuclear power and its energy costs were 8th lowest in the nation some time ago. The oil energy industry contributes 35 billion USD to Oklahoma's gross domestic product. Thus, the employees of Oklahoma state oil-related companies earn about twice the state's typical annual income. The City-based SandRidge Energy Corporation, Devon Energy Corporation and Chesapeake Energy Corporation are the largest private oil-related companies in the United States of America. At the same time, all of the Oklahoma's Fortune 500 companies are energy-related, having Tulsa's Williams and ONEOK Companies as the largest and 2nd-largest companies, ranking as the nation's 2nd- and 3rd-largest companies in the field of energy.
The government sector in this state provides the most jobs, followed by the utilities and transportation sector, providing over 279500 jobs. The sectors of manufacturing, education and business are also in demand, providing about 500000 jobs. The aerospace sector generates 11 billion USD annually. In general, aerospace accounts for over 10% of Oklahoma's industrial output, being one of the top 10 states in aerospace engine manufacturing in the USA. This state is also among the top states for logistic centres as well as a major contributor to weather-related research.
This state is on the top place among the American manufacturers of tires in its northern part, containing one of the fastest-growing biotechnology industries in the United States. Apart from the tire manufacturing, the meat processing as well as the oil and gas equipment manufacturing is common for this state to associate with. The manufacturing of the air conditioners is also one of the largest manufacturing industries in Oklahoma.
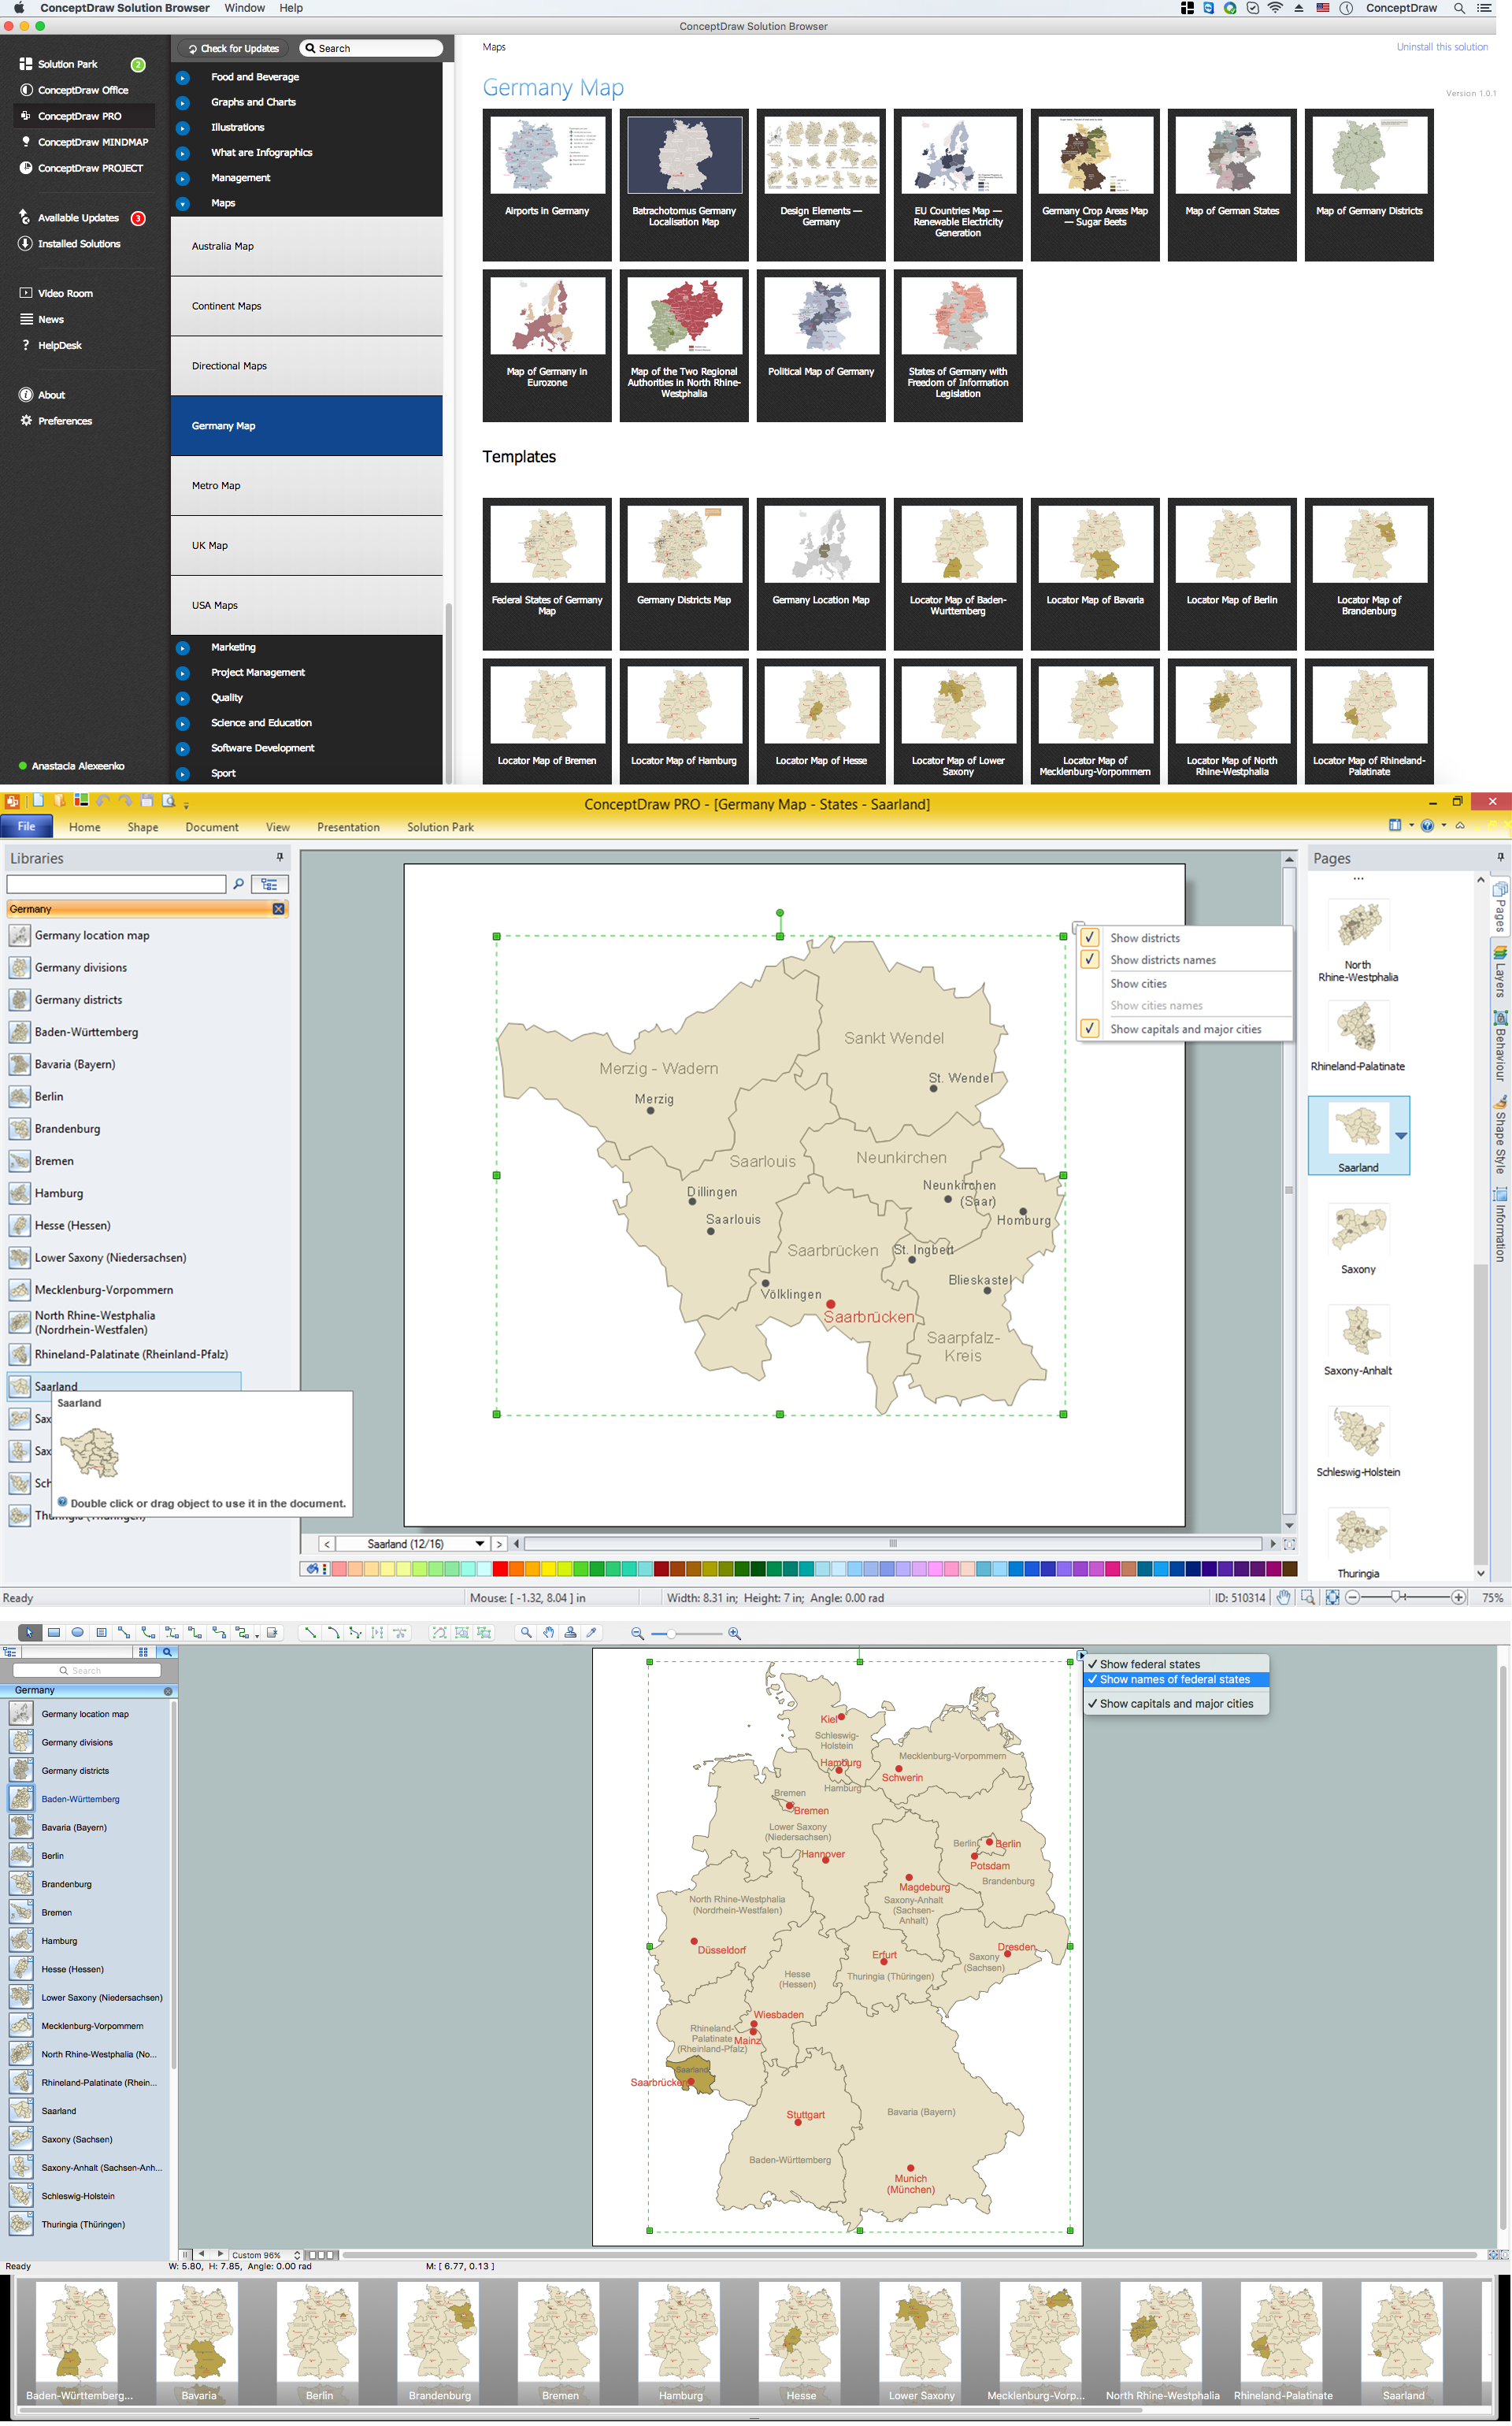
Describing the features of this state using only text is not as convenient for understanding for those who you want to be aware of the information, which is aimed to be represented. It is always better to mention the details, including the statistics about the state’s economy and production, using the illustrations, such as maps. To create your own map may seem to be a challenge unless you have ConceptDraw DIAGRAM drawing software, but once you download this unique application, you will realize how simple it is to be used for creating the great looking maps.
Thus, having this tool as well as the “Continent Maps solution” from “Maps area” of ConceptDraw Solution Park from this site, which includes, apart from the pre-made templates of the maps of this state, also the vector stencils library “Oklahoma” with the needed contours, can simplify your work of making the maps while working in the ConceptDraw DIAGRAM diagramming and vector drawing software.

Pic. 1. Continent Maps Solution
Use the Oklahoma library to draw thematic maps, geospatial infographics and vector illustrations for your business documents, presentations and websites.
Geo Map — USA — State of Oklahoma
Area 69,899 sq mi (181,295 km²); Width 230 miles (370 km); Length 465 miles (750 km).

Pic. 2. Oklahoma
Geo Map — USA — Oklahoma Contour
Capital — Oklahoma City.

Pic. 3. Oklahoma Contour
Geo Map — USA
The United States of America (USA), commonly referred to as the United States (U.S.) or America, is a federal republic composed of 50 states, a federal district, five major territories and various possessions.

Pic. 4. USA Map
Geo Map — USA Contour
A contour map is a map illustrated with contour lines.

Pic. 5. USA Contour
Geo Map — contours of Territories of the United States
Use the map contours library "United States of America" to design thematic maps using the ConceptDraw DIAGRAM diagramming and vector drawing software.
The vector stencils library "United States of America" contains 53 map contours: US political map, map contours of states.

Pic. 6. Contours of Territories of the United States
All ConceptDraw DIAGRAM documents are vector graphic files and are available for reviewing, modifying, and converting to a variety of formats: image, HTML, PDF file, MS PowerPoint Presentation, Adobe Flash, MS Visio (.VDX, .VSDX).
See Also Territories of the United States Geo Maps :
- Alabama
- Alaska
- Arizona
- Arkansas
- California
- Colorado
- Connecticut
- Delaware
- Florida
- Georgia
- Hawaii
- Idaho
- Illinois
- Indiana
- Iowa
- Kansas
- Kentucky
- Louisiana
- Maine
- Maryland
- Massachusetts
- Mexico
- Michigan
- Minnesota
- Mississippi
- Missouri
- Montana
- Nebraska
- Nevada
- New Hampshire
- New Jersey
- New Mexico
- New York
- North Carolina
- North Dakota
- Ohio
- Oklahoma
- Oregon
- Pennsylvania
- Tennesse
- Utah
- Vermont
- Virginia
- Washington
- West Virginia
- Wisconsin
- Wyoming
- United States