The vector stencils library " DFD , Gane - Sarson notation " contains 12 DFD
elements. Use it for drawing data flow diagrams ( DFD ) using Gane - Sarson
notation in
Gane Sarson Diagram *

Gane Sarson Diagram
Once you want to build some smart logical model of some system using graphical techniques to enable users, designers and well as analysts to get a clear and common picture of this system and how its parts fit together to meet the user's needs, we recommend to use Gane and Sarson method in order to create Gane and Sarson diagram. Such diagram, as many others, can be made with help of our unique and sophisticated software - ConceptDraw DIAGRAM is here for you to enable you to use any of existing templates and samples as well as numerous stencil libraries full of design elements and symbols so the final result looks very sophisticated and very professional. Download ConceptDraw DIAGRAM right now and find our Gane-Sarson notation library to start creating your great looking, smart and sophisticated diagram. In the end you can always review, modify or convert it to a variety of formats, such as image, PDF file, HTML, MS PowerPoint Presentation MS Visio or Adobe Flash, as well as print or send it by e-mail in one second.Data Flow Diagram Symbols. DFD Library *

Data Flow Diagram Symbols . DFD Library
Showing information transfers and processing some system’s steps, it is better to illustrate such processes on a diagram in a way of data flow one. Data flow diagram (DFD) is the one to represent the connections and relationships between users and developers. Using structured systems analysis in terms of displaying the inputs and the outputs is possible with Data Flow Diagram software called ConceptDraw DIAGRAM all together with templates and samples existing and in advance created for your use to make it easier to use our product and to let your business grow and prosper. Find over 1000 symbols we offer to create your diagram and try to review final one, modify as well as convert it to a variety of formats: PDF, HTML, Adobe Flash, MS PowerPoint Presentation, MS Visio, or print it, or send quick via e-mail. Section Solutions on this site can be very helpful to start and it will help you to get used to ConceptDraw DIAGRAM as there are many tutorials and articles as well as videos and samples.Data Flow Diagram (DFD) *
 *")
Data Flow Diagram ( DFD )
Trying to show the interaction between some system and its external agents that act as data sinks and data sources, you wonder about the best way of making it and we can now recommend you to create the data flow diagram or DFD in order to make it simpler to understand the all existing connections. To draw such diagram sounds like very complex thing, but once you download ConceptDraw DIAGRAM in order to use it as a professional tool for drawing the charts, flowcharts, diagrams, plans ad schemes, you will find the process of drawing very entertaining and simple as there are so many stencil libraries with so many design symbols which you can use for making any diagram, including the data flow one. Discover our smart product and explore its application called ConceptDraw STORE to make a professionally looking diagram having no previous experience in making it before.Example of DFD for Online Store

Example of DFD for Online Store. Data Flow Diagram
Showing the connections between different components of same system you can make data flow diagram (DFD) to display the relationships and the interactions of different departments in the shop, for example. So making the DFD for the online store you have to mention all involved parties such as Administrator, Customer, Visitor, Manager, etc. To create this diagram can be much easier with help of the layouts from the libraries in the Solution Park here on this site or you can download the ConceptDraw STORE to have all the samples to your service. Using the existing examples from the libraries can simplify the work of drawing the needed flowcharts and diagrams for any kind of businesses. Data flow diagram, Gane-Sarson notation as well as Yourdon and Coad notation libraries contain all together 49 symbols you can use for making charts. You can find Data Flow Diagrams Solution in the Software Development area of ConceptDraw Solution Park on this site and start making your own project. Download ConceptDraw DIAGRAM now and enjoy using the sophisticated application for making your life easier!Data Flow Diagram Software *

Data Flow Diagram Software
Data Flow Diagram Software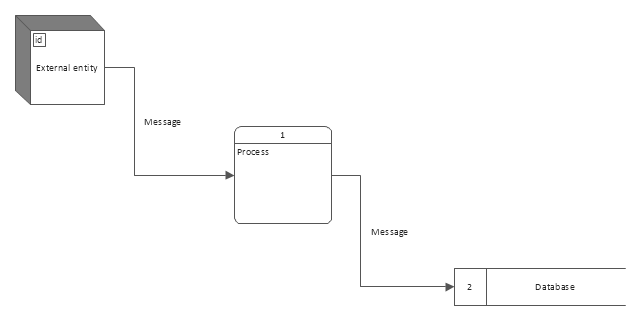
Use this template to create your data flow diagrams ( DFD ) by Gane - Sarson ( DFD
) notation using the ConceptDraw PRO diagramming and vector drawing
 Data Flow Diagrams ( DFD )
Using the pre-made templates and samples of the DFDs as well as the stencil
This sample shows a DFD ( Yourdon and Coad notation ) diagram describing the
Diagramming Software for Design UML Interaction Overview Diagrams *

Interaction Overview Diagram UML2.0. Professional UML Drawing
uml interaction overview diagram for macData Flow Diagrams *

Data Flow Diagram Example , Sample Data Fow Diagram
Working with lots of information analyzing it and arranging, it seems to be necessary to have software which can allow you to specify and range data, as well as illustrate data flow in a way of a diagram. Whether you need to display functional transforms, external entities, data flows, data storage as well as to control signals and transforms, you can always use diagram for such purpose and ConceptDraw DIAGRAM can help you to create it using also ConceptDraw STORE application full of libraries and examples of pre-designed charts which you can edit the way you need them to be and to look like in the very final form. Making your own flowcharts is simple using this product and to start with it would be enough to go to our Solutions section on this site to read about different kinds of schemes, flowcharts, diagrams and plans to find out how easy it is to use our software. Representing data flows, objects, processes and data storage with help of vector elements from the Object Library can be done during one day for the very beginner. Once you start today you’ll be so much better tomorrow and you’ll be able to use it making professionally looking charts in a few minutes only.How to Make Audio and Video Connections *

How to Make Audio and Video Connections. Libraries, Templates
Design elements - Audio video connectorsData Flow Diagram *

Data Flow Diagram , workflow diagram, process flow diagram
The standards for the Structured Systems Analysis and Design Methodology (SSADM) were developed for systems analysis and application design in the UK in the early 80s. Data Flow Diagrams (DFD) are very common and popular nowadays and they are being used in the SSADM method for representing data flows in the information system (IS) and for analysing the data processing during the structural projection. To visualize processes, external entities or data depositories in IS and data flows in order to connect these elements, you can create DFD with help of ConceptDraw DIAGRAM software as well in the application called ConceptDraw STORE where you can find lots of pre-designed samples and templates to make your flowcharts look professional and sophisticated as there are thousands of ready-to-use vector objects developed especially for this purpose. Also you can find many design elements here on our site in the Solutions section. Check for the examples and templates and make your charts look smart and mature even if you had no experience in making them before.IDEF0 Flowchart Symbols *

IDEF0 Flowchart Symbols
Using an Integration Definition for Function Modeling or shortly IDEF is one of the way to cover a wide range of uses, from the functional modeling to the object-oriented analysis and design as it relates to the family of modeling languages in the field of systems and software engineering. There are many different types of IDEF methods and so diagrams and two of them are being used as the base for business process models - IDEF3 and IDEF0. If you want to make one of these or both of these diagrams, then ConceptDraw DIAGRAM software can be helpful in making it very simple for you in terms of creating any kind of diagram, as well as charts, flowchart and plans, any scheme you want in a very short period of time having the final result looking very professional and being able to convert it to the various formats, including PPT, PDF, MS Visio, HTML, and many other graphic ones.UML Class Diagrams. Diagramming Software for Design UML Diagrams *

UML Class Diagram. Design of the Diagrams. Business Graphics
uml class diagram for macBasic Flowchart Images. Flowchart Examples *

Basic Flowchart Images. Flowchart Examples
Basic Flowchart Images. 2PP counting flowchartDFD Flowchart Symbols *

DFD Flowchart Symbols
DFD Flowchart SymbolsDFD Library — Design elements *

DFD Library - Design elements
Yourdon and Coad and Gane and Sarson notations can be used for drawing data flow diagrams. ConceptDraw DIAGRAM allows our clients to use our libraries full of stencil elements in order to make any needed diagrams, including library "Data flow diagram (DFD)" which contains 15 symbols for drawing both context-level data flow diagram and Level 1 DFD. Also library called "DFD, Gane-Sarson notation" allows to do the similar thing containing 12 symbols of Gane-Sarson DFD notation. Having them all for your use, including library named "DFD, Yourdon and Coad notation" which contains 22 symbols of Yourdon/DeMarco DFD notation allows you to make what you want and to have the final result looking very professional. Drawing data flow diagram (or DFD) which is a graphical representation of the "flow" of data through an information system, modelling its process aspects, seems to be quite difficult until you download ConceptDraw DIAGRAM and start using it.Building Networks *

Building Networks. Professional Network Drawing
Mobile TV network diagramDesign Data Flow. DFD Library *

Design Data Flow. DFD Library
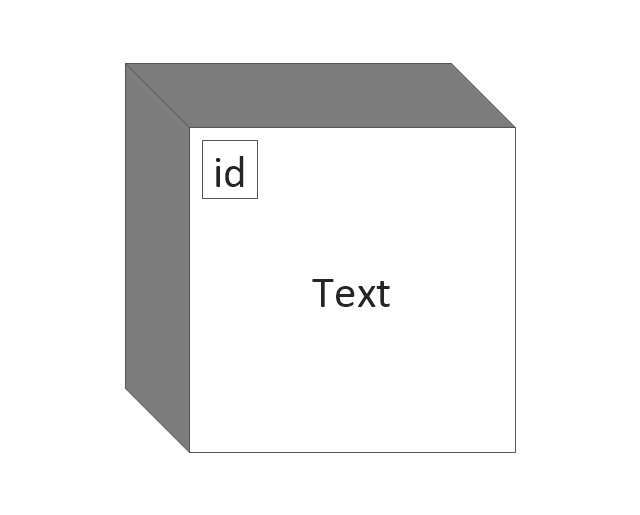
In case you want to learn how to make diagrams professionally having no previous experience in drawing them before, we can recommend you to start with making data flow diagrams and the number one advisor for you will be ConceptDraw DIAGRAM software as it allows to make any needed diagram as well as any chart, flowchart, plan or schemes in a very short time having lots of libraries with lots of design elements which can be helpful during the process of creating great looking professional diagrams. Thus, one of the libraries is Data flow diagram (DFD) which consists such design symbols as State (multi state), Start state (multi state), Stop state (multi state), External interactor, Stop state, Data store, Entity relationship, Entity, Oval process, Entity with ID and location (rounded corners), Data store (with ID), Entity (rounded corners) and Object and that is only one of so many different libraries we created in advance all for our users.SWOT Sample in Computers *

SWOT Sample in Computers
Illustrating Strengths, Weaknesses, Opportunities and Threats of some business environment or business organization is always better in a way of SWOT analysis in a way of table where all the details are mentioned in order having Strengths in same column with Opportunities and Weaknesses and Threats in the same column just next to the first one the right. So having them all mentioned in four blocks next to each other having the internal and external blocks on the left side and lead to making the analysis and so the result which will lead to solutions in terms of making the company succeed. drawing SWOT Matrix is simple having ConceptDraw DIAGRAM software and for using it properly this site can be very helpful as there are so many examples, tutorials and articles as well as links to the Solutions full of design elements and templates. Download it today and make your analysis by tomorrow looking great and very professional.- Gane Sarson Diagram | DFD , Gane - Sarson notation - Template ...
- DFD , Gane - Sarson notation - Vector stencils library | Gane Sarson ...
- DFD , Gane - Sarson notation - Vector stencils library | DFD , Gane ...
- DFD , Gane - Sarson notation - Template
- DFD , Yourdon and Coad notation - Vector stencils library | DFD ...
- DFD , Gane - Sarson notation - Vector stencils library
- DFD , Gane - Sarson notation - Vector stencils library | Diagram Of ...
- DFD , Yourdon and Coad notation - Template
- Data flow diagram - Template | DFD , Yourdon and Coad notation ...
- Typical Examples Of Gane And Sarson Symbols
- Data Flow Diagrams ( DFD ) | Process Oriented Design By Gane ...
- DFD , Yourdon and Coad notation - Template | DFD , Gane - Sarson ...
- Data Flow Diagrams ( DFD ) | Data Flow Model Diagram
- Difference Between Data Flow Diagram And Architecture Diagram
- Gane And Sarson Symbols
- Accounting Information Systems Flowchart Symbols | Gane Sarson ...
- DFD , Gane - Sarson notation - Template | DFD - Model of small ...
- Enterprise Architecture Diagrams | Data Flow Diagrams ( DFD ) | Data ...
- Gane Sarson Diagram | Structured Systems Analysis and Design ...
- Data Flow Diagrams ( DFD )