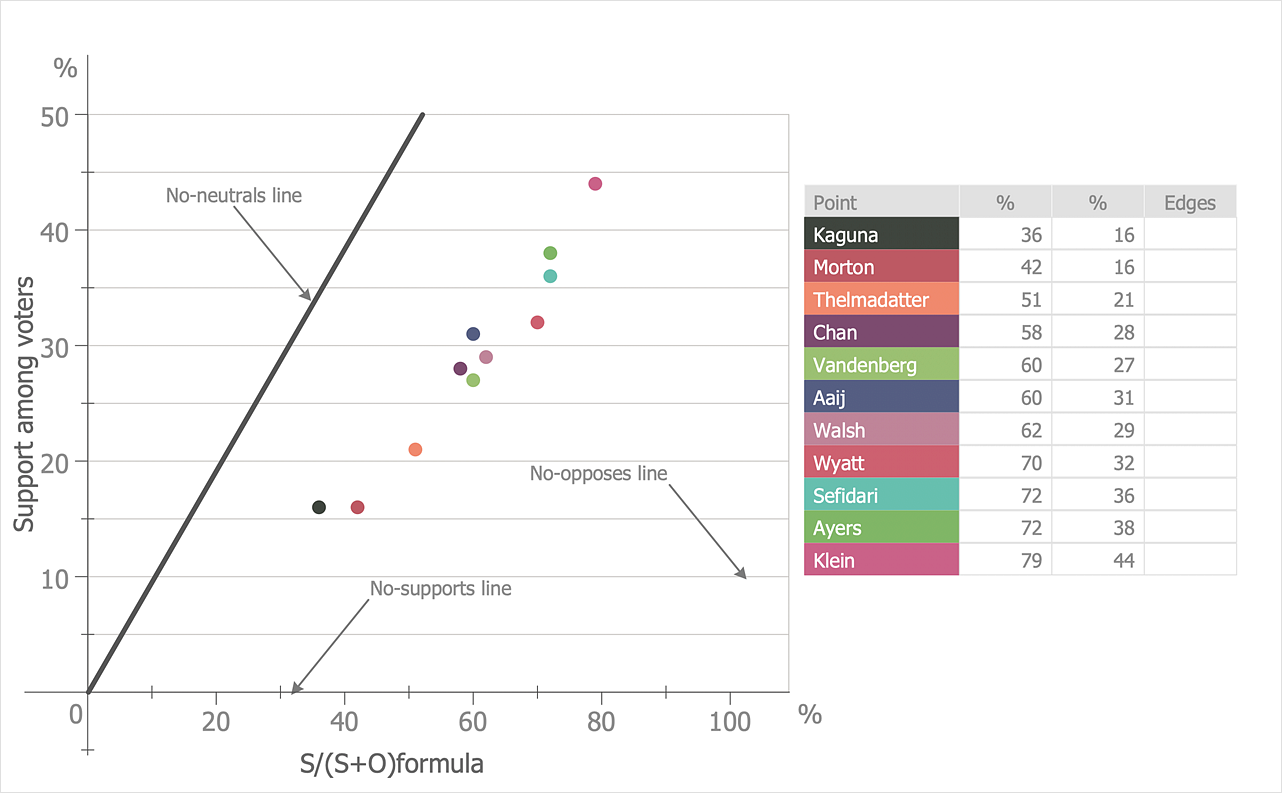
Scatter Chart Examples
The Line Graphs solution from Graphs and Charts area of ConceptDraw Solution Park contains a set of examples, templates and design elements library of scatter charts.Use it to draw scatter graphs using ConceptDraw DIAGRAM diagramming and vector drawing software for illustrating your documents, presentations and websites.
 Scatter Diagrams
The Scatter Diagrams solution extends ConceptDraw DIAGRAM functionality with templates, samples, and a library of vector stencils that make construction of a Scatter Plot easy. The Scatter Chart Solution makes it easy to design attractive Scatter Diagrams used in various fields of science, work, and life activities. ConceptDraw DIAGRAM lets you enter the data to the table and construct the Scatter Plot Graph automatically according to these data.
HelpDesk
How to Draw a Scatter Diagram
Scatter Diagrams are used to visualize how a change in one variable affects another. A Scatter Diagram displays the data as a set of points in a coordinate system. It combines these values into single data points and displays them in uneven intervals. A Scatter Diagram can be very useful for identifying relationships between variables, for example, the relationship between price and quality rating. Making a Scatter Diagram involves many different elements that can be managed using ConceptDraw Scatter Diagram solution.Scatter Graph
You've got to draw the Scatter Graph and look for the convenient tool which will help you? Direct your attention on the ConceptDraw DIAGRAM diagramming and vector drawing software extended with Scatter Diagrams Solution from the Graphs and Charts Area.Line Graph
Looking for the line graph examples you can simply go to the Line Graphs solution of ConceptDraw STORE to get those which were previously created especially for the ConceptDraw DIAGRAM users in order to simplify their work of making such charts.Scatter Graph Charting Software
ConceptDraw provides some interactive xy chart and scatter graph symbols that offers advanced features yet is simple to use.Swim Lane Diagrams
Swim Lane diagrams are the variety of process flow diagrams and are based on the IDEF3 standard. They were developed by Lynn Shostack for usage in projecting. With their help organization diagrams are combined with process flow, as they visually display an object of the production system which is charged with given concrete processes in general flow of processes of the production system.Scatter Plot
A scatter plot is also known to be called as a scatter graph, scatterplot, scatter chart, scatter diagram or scattergram. It is a type of a plot or mathematical diagram and to make it the Cartesian coordinates can be used for displaying the numeral values for usually two variables for one set of data.Pie Chart Examples and Templates
A pie chart or a circle graph is a circular chart divided into sectors, illustrating numerical proportion. In a pie chart, the arc length of each sector and consequently its central angle and area, is proportional to the quantity it represents.Pie chart examples and templates created using ConceptDraw DIAGRAM software helps you get closer with pie charts and find pie chart examples suite your needs.
Chart Templates
Easy charting software comes with beautiful chart templates and examples. This makes it easy to create professional charts without prior experience.- Scatter Chart Examples | Scatter Diagrams | How to Draw a Scatter ...
- Example Of A Scatter Graph
- Scatter Diagrams | Blank Scatter Plot | How to Draw a Scatter ...
- Scatter Diagrams | How to Draw a Scatter Diagram Using ...
- Scatterplot Diagram On Tqm With Example
- Scatter Diagrams | Basic Scatter Diagrams | Total Quality ...
- Scatter Diagrams | Scatter Graph | Scatter Chart Examples | Scatter ...
- Scatter Graph Charting Software | Scatter Chart Examples | Scatter ...
- Scatter Graph Charting Software | Scatter Diagrams | How to Draw a ...
- Chart Templates | How to Create a Scatter Chart | Chart Examples ...
- ERD | Entity Relationship Diagrams, ERD Software for Mac and Win
- Flowchart | Basic Flowchart Symbols and Meaning
- Flowchart | Flowchart Design - Symbols, Shapes, Stencils and Icons
- Flowchart | Flow Chart Symbols
- Electrical | Electrical Drawing - Wiring and Circuits Schematics
- Flowchart | Common Flowchart Symbols
- Flowchart | Common Flowchart Symbols


