Example Process Flow

 Accounting Flowcharts
Accounting Flowcharts solution extends ConceptDraw PRO software with templates, samples and library of vector stencils for drawing the accounting flow charts.
Best Program to Create a Fowchart

Basic Diagramming Flowchart Software

Flowchart

How To Create a FlowChart using ConceptDraw

Example of DFD for Online Store (Data Flow Diagram) DFD Example


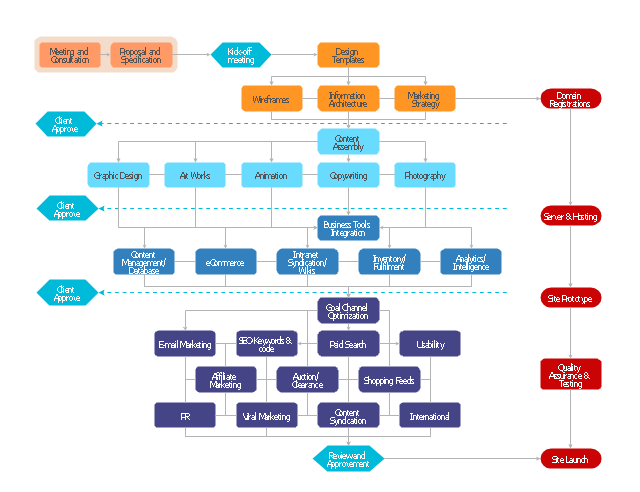
"A website, also written as Web site, web site, or simply site, is a set of related web pages served from a single web domain. A website is hosted on at least one web server, accessible via a network such as the Internet or a private local area network through an Internet address known as a Uniform resource locator. All publicly accessible websites collectively constitute the World Wide Web.
A webpage is a document, typically written in plain text interspersed with formatting instructions of Hypertext Markup Language (HTML, XHTML). A webpage may incorporate elements from other websites with suitable markup anchors.
Webpages are accessed and transported with the Hypertext Transfer Protocol (HTTP), which may optionally employ encryption (HTTP Secure, HTTPS) to provide security and privacy for the user of the webpage content. The user's application, often a web browser, renders the page content according to its HTML markup instructions onto a display terminal.
The pages of a website can usually be accessed from a simple Uniform Resource Locator (URL) called the web address. The URLs of the pages organize them into a hierarchy, although hyperlinking between them conveys the reader's perceived site structure and guides the reader's navigation of the site which generally includes a home page with most of the links to the site's web content, and a supplementary about, contact and link page." [Website. Wikipedia]
The flow chart example "Website launch" was created using the ConceptDraw PRO diagramming and vector drawing software extended with the Flowcharts solution from the area "What is a Diagram" of ConceptDraw Solution Park.
Flowchart - Website launch
 Flowcharts
The Flowcharts solution for ConceptDraw PRO is a comprehensive set of examples and samples in several varied color themes for professionals that need to represent graphically a process. Solution value is added by the basic flow chart template and shapes' libraries of flowchart notation. ConceptDraw PRO flow chart creator lets one depict the processes of any complexity and length, as well as design the Flowchart either vertically or horizontally.
Flowchart Software


How to Create a Social Media DFD Flowchart

Basic Flowchart Symbols and Meaning

Basic Diagramming


 Event-driven Process Chain Diagrams
Event-driven Process Chain (EPC) Diagram is a type of flowchart widely used for modeling in business engineering and reengineering, business process improvement, and analysis. EPC method was developed within the Architecture of Integrated Information Systems (ARIS) framework.
This flow chart sample was drawn on the base on the illustration of the article "Climate change impact on China food security in 2050" from the website of Chinese Academy of Agricultural Sciences .
[caas.cn/ en/ newsroom/ research_ update/ 67347.shtml]
"Food security is a condition related to the ongoing availability of food. ...
According to the Food and Agriculture Organization (FAO), food security "exists when all people, at all times, have physical and economic access to sufficient, safe and nutritious food to meet their dietary needs and food preferences for an active and healthy life". ...
Extreme events, such as droughts and floods, are forecast to increase as climate change takes hold. Ranging from overnight floods to gradually worsening droughts, these will have a range of impacts on the agricultural sector. ...
According to the Climate & Development Knowledge Network report Managing Climate Extremes and Disasters in the Agriculture Sectors: Lessons from the IPCC SREX Report, the impacts will include changing productivity and livelihood patterns, economic losses, and impacts on infrastructure, markets and food security. Food security in future will be linked to our ability to adapt agricultural systems to extreme events." [Food security. Wikipedia]
The flowchart example "Food security assessment" was created using the ConceptDraw PRO diagramming and vector drawing software extended with the Flowcharts solution from the area "What is a Diagram" of ConceptDraw Solution Park.
Flowchart

Basic Diagramming

The Best Flowchart Software Available


 Infographics Area
Solutions of the area What is Infographics from ConceptDraw Solution Park collect templates, samples and vector stencils libraries with design elements for the drawing information graphics.
- Example Process Flow | Best Program to Create a Fowchart ...
- Accounting Flowcharts | Example Process Flow | How To Create a ...
- Example Process Flow | How To Create a FlowChart using ...
- Flowchart - Website launch | Best Program to Create a Fowchart ...
- Example Process Flow | Accounting Flowcharts | Best Program to ...
- Accounting Flowcharts | Example Process Flow | Flowcharts |
- Example Process Flow | Best Program to Create a Fowchart | How ...
- Data Flow Diagrams
- Best Program to Create a Fowchart | Flowchart - Website launch ...
- Example Process Flow | Accounting Flowcharts | Flowcharts |
- Accounting Flowcharts | Best Program to Create a Fowchart | How ...
- Business Flowchart Generation with ConceptDraw PRO | How to ...
- Data Flow Diagrams
- ConceptDraw Solution Park | How To Create a FlowChart using ...
- Example Process Flow | Flow Chart Diagram Examples | Accounting ...
- Flowchart Program Mac | Create Flow Chart on Mac | ConceptDraw ...
- Example Process Flow | Process Flowchart | DFD - Process of ...
- Example Process Flow | Accounting Flowcharts | Cross-Functional ...
- Example Process Flow | Flow Chart Diagram Examples | Process ...
- Build a Flowchart Quickly With AutoConnect | Cross-Functional ...