 SWOT and TOWS Matrix Diagrams
SWOT and TOWS Matrix Diagrams solution extends ConceptDraw PRO and ConceptDraw MINDMAP software with features, templates, samples and libraries of vector stencils for drawing SWOT and TOWS analysis matrices and mind maps.
HelpDesk
How to Create a Data Flow Diagram using ConceptDraw PRO
Data flow diagramming is a highly effective technique for showing the flow of information through a system. Data flow diagrams reveal relationships among and between the various components in a program or system. DFD is an important technique for modeling a system’s high-level detail by showing how input data is transformed to output results through a sequence of functional transformations. The set of standard symbols is used to depict how these components interact in a system. ConceptDraw PRO allows you to draw a simple and clear Data Flow Diagram using special libraries.
 ConceptDraw Solution Park
ConceptDraw Solution Park collects graphic extensions, examples and learning materials
 Data Flow Diagrams (DFD)
Data Flow Diagrams solution extends ConceptDraw PRO software with templates, samples and libraries of vector stencils for drawing the data flow diagrams (DFD).
HelpDesk
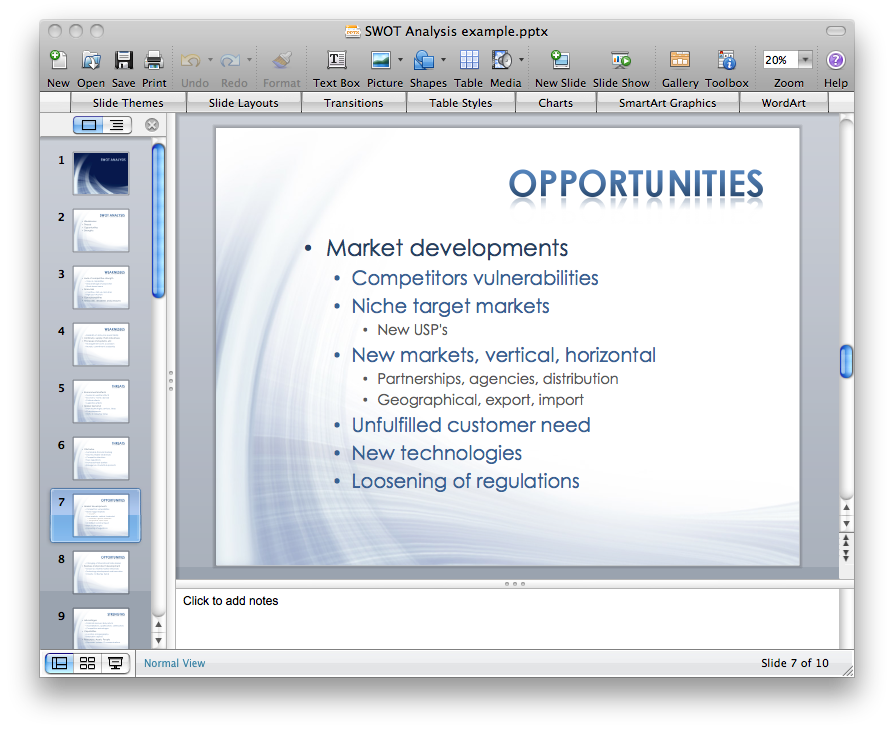
How to Create a PowerPoint Presentation from a SWOT Matrix
You can use SWOT analysis PowerPoint presentation to represent strengths, weakness, opportunities, and threats involved in your SWOT matrix.HelpDesk
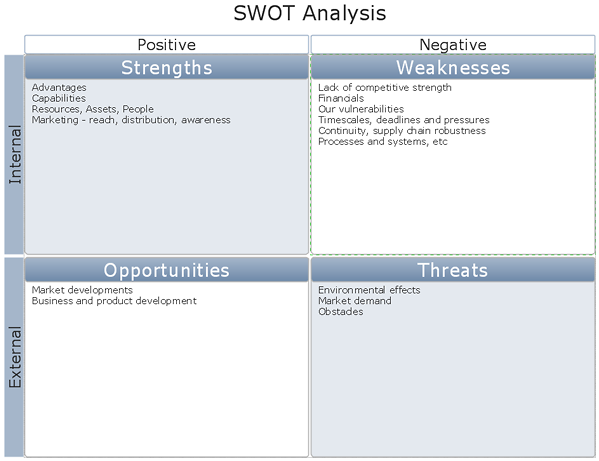
How to Create SWOT Analysis Template Using ConceptDraw PRO
SWOT-analysis is used to develop a marketing strategy. SWOT-analysis includes determining the strengths and weaknesses in the company's activity, potential external threats and opportunities and assesses their relative strategic competitors. ConceptDraw SWOT and TOWS Matrix Diagrams solution provide a set of SWOT matrix in which should be recorded and then compared the strengths and weaknesses of the enterprise and the market opportunities and threats. This comparison allows you to determine what steps can be taken for the development of your company and what problems need to be addressed urgently.HelpDesk
How to Create a SWOT Matrix Quickly
ConceptDraw PRO allow create SWOT Matrix in just one click for presenting analysis results preformed in mimd map structure using ConceptDraw MINDMAP.
 Management Area
The solutions from Management area of ConceptDraw Solution Park collect templates, samples and libraries of vector stencils for drawing the management diagrams and mind maps.
 Engineering
This solution extends ConceptDraw PRO v9.4 with the ability to visualize industrial systems in electronics, electrical, chemical, process, and mechanical engineering.
HelpDesk
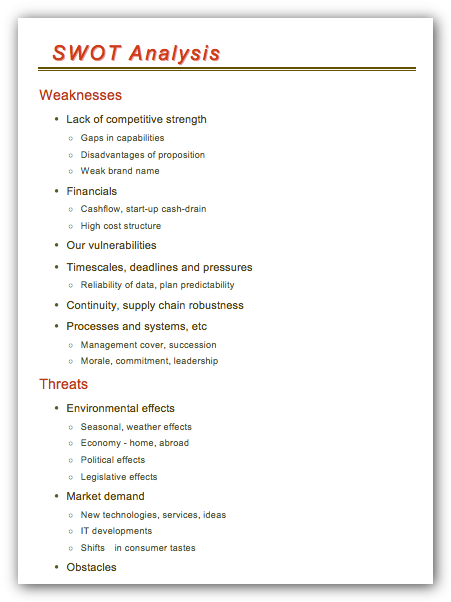
How to Make SWOT Analysis in a Word Document
A SWOT analysis is a strategic planning tool that helps to identify and compare strengths and weaknesses with opportunities and threats to make a decision and create an action plan. When performing a SWOT analysis, one can create a table split up into four columns so as to list each impacting element side-by-side for comparison, but typically it is conducted using a four-square SWOT analysis template. Using mind map allows you to collect and structure an information involved in SWOT Analysis then, you can export your SWOT mind map into a MS Word document that allows you to present and collaborate your business strategic SWOT analysis matrix in MS Word document.
 Audit Flowcharts
Audit flowcharts solution extends ConceptDraw PRO software with templates, samples and library of vector stencils for drawing the audit and fiscal flow charts.
 Accounting Flowcharts
Accounting Flowcharts solution extends ConceptDraw PRO software with templates, samples and library of vector stencils for drawing the accounting flow charts.
 Business Productivity Area
Business Productivity Solutions extend ConceptDraw products with tools for making presentations, conducting meetings, preparing documents, brainstorming, or building new strategies.
 Cross-Functional Flowcharts
Cross-functional flowcharts are powerful and useful tool for visualizing and analyzing complex business processes which requires involvement of multiple people, teams or even departments. They let clearly represent a sequence of the process steps, the order of operations, relationships between processes and responsible functional units (such as departments or positions).
 Universal Diagramming Area
This area collects solutions for drawing diagrams, charts, graphs, matrices, geographic and road maps for education, science, engineering, business.
ConceptDraw PRO 9 Comparison with Omnigraffle Professional and MS Visio
ConceptDraw PRO 9 Comparison with Omnigraffle Professional and MS Visio.All source ConceptDraw documents are vector graphic documents. They are available for reviewing, modifying, or converting to a variety of formats: PDF file, MS PowerPoint, MS Visio, and many other graphic formats.
 Fault Tree Analysis Diagrams
This solution extends ConceptDraw PRO v9.5 or later with templates, fault tree analysis example, samples and a library of vector design elements for drawing FTA diagrams (or negative analytical trees), cause and effect diagrams and fault tree diagrams.
 Fishbone Diagrams
The Fishbone Diagrams solution extends ConceptDraw PRO v10 software with the ability to easily draw the Fishbone Diagrams (Ishikawa Diagrams) to clearly see the cause and effect analysis and also problem solving. The vector graphic diagrams produced using this solution can be used in whitepapers, presentations, datasheets, posters, and published technical material.
- Engineering | Data Flow Diagrams | Universal Diagramming Area ...
- SWOT analysis matrix diagram examples | SWOT Analysis Tool for ...
- Flowchart Software | Data Flow Diagrams | How To Create Home ...
- Structured Systems Analysis and Design Method (SSADM) with ...
- SWOT analysis matrix diagram templates | Pyramid Chart Examples ...
- Flow Chart of Marketing Analysis
- Structured Systems Analysis and Design Method (SSADM) with ...
- SWOT analysis diagram - Template | SWOT Analysis | Entity ...
- UML Activity Diagram
- SWOT analysis matrix diagram templates | Pie Chart Examples and ...
- Spatial Data Analysis | Data Flow Diagrams (DFD) | Spatial ...
- Process decision program chart (PDPC) - Personal activity | SWOT ...
- SWOT Analysis | Manufacturing and Maintenance | Fishbone ...
- Fishbone Diagram | Fault Tree Analysis Diagrams | TOWS analysis ...
- Data Flow Diagrams
- Fishbone Diagram | Porter's value chain diagram template | SWOT ...
- Data Flow Diagram Model
- Design elements - SWOT and TOWS analysis matrices | Design ...
- Marketing | SWOT analysis matrix diagram templates | Comparison ...
- SWOT analysis for a small independent bookstore | Office Layout ...


