UML Activity Diagram. Design Elements


Structured Systems Analysis and Design Method (SSADM) with ConceptDraw DIAGRAM

Flowchart design. Flowchart symbols, shapes, stencils and icons


SSADM Diagram

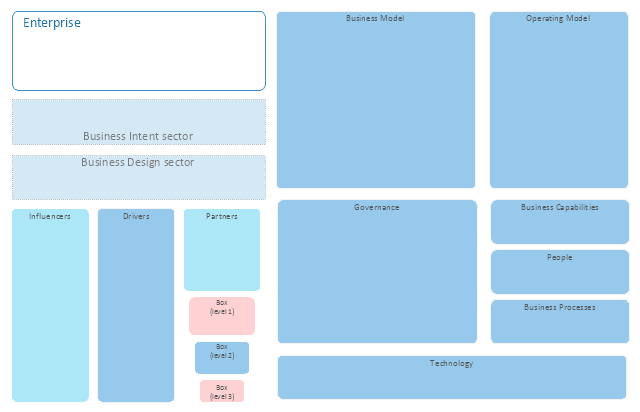
This library of vector stencils "Enterprise architecture diagrams" contains 16 shapes for visualizing the enterprise architecture (EA) models using the ConceptDraw PRO diagramming and vector drawing software.
"Enterprise architecture (EA) is "a well-defined practice for conducting enterprise analysis, design, planning, and implementation, using a holistic approach at all times, for the successful development and execution of strategy. Enterprise Architecture applies architecture principles and practices to guide organizations through the business, information, process, and technology changes necessary to execute their strategies. These practices utilize the various aspects of an enterprise to identify, motivate, and achieve these changes."
Practitioners of EA call themselves enterprise architects. An enterprise architect is a person responsible for performing this complex analysis of business structure and processes and is often called upon to draw conclusions from the information collected. By producing this understanding, architects are attempting to address the goals of Enterprise Architecture: Effectiveness, Efficiency, Agility, and Durability." [Enterprise architecture. Wikipedia]
The example "Design elements - Enterprise architecture diagram" is included in the Enterprise Architecture Diagrams solution from the Management area of ConceptDraw Solution Park.
Enterprise architecture diagram shapes
Flowchart Definition

Lean Manufacturing Diagrams

JSD - Jackson system development

Fishbone Diagram Design Element
.png)
 Fishbone Diagrams
The Fishbone Diagrams solution extends ConceptDraw DIAGRAM software with the ability to easily draw the Fishbone Diagrams (Ishikawa Diagrams) to clearly see the cause and effect analysis and also problem solving. The vector graphic diagrams produced using this solution can be used in whitepapers, presentations, datasheets, posters, and published technical material.