Data Flow Diagram Model

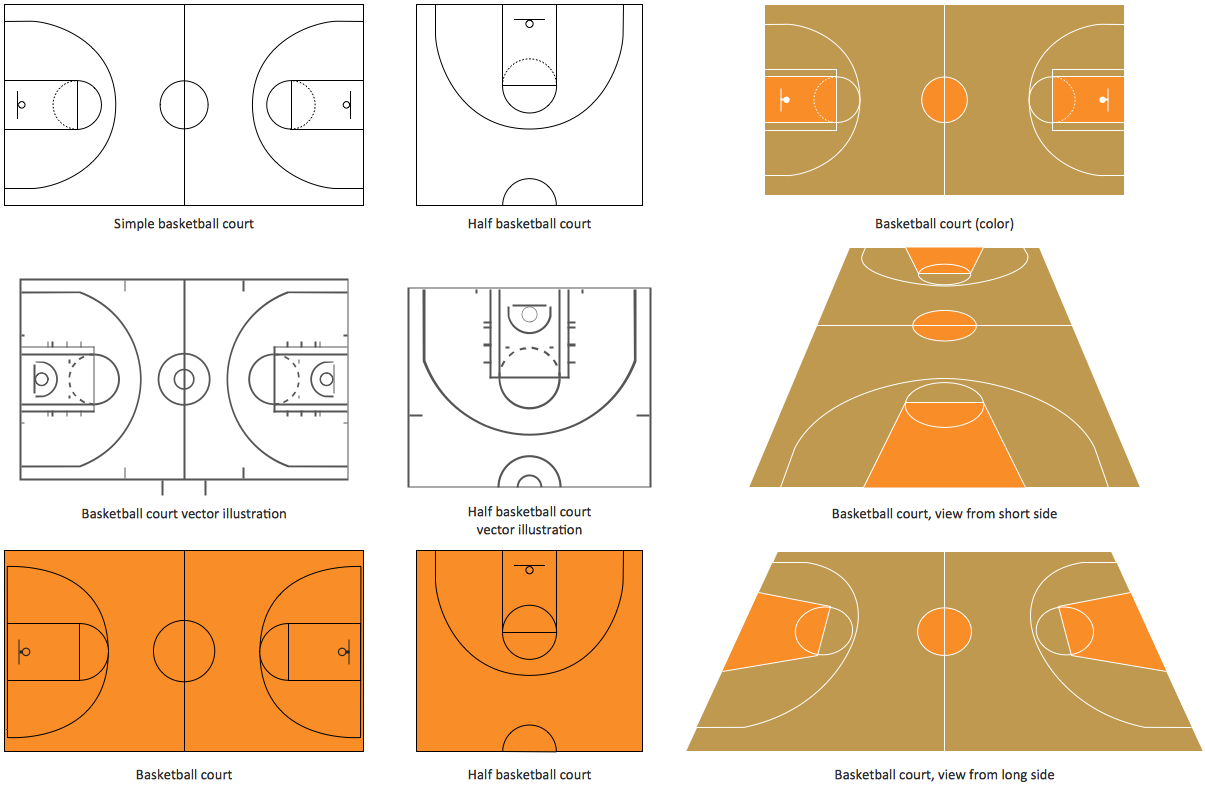
Basketball Court Diagram and Basketball Positions
Hotel Plan. Hotel Plan Examples

This example was redesigned from the Wikipedia file: LastResortHotel BookRoom Process.png. [en.wikipedia.org/ wiki/ File:LastResortHotel_ BookRoom_ Process.png]
This file is licensed under the Creative Commons Attribution-ShareAlike 3.0 License. [creativecommons.org/ licenses/ by-sa/ 3.0/ ]
"Event partitioning is an easy-to-apply systems analysis technique that helps the analyst organize requirements for large systems into a collection of smaller, simpler, minimally-connected, easier-to-understand ‘mini systems’ / use cases. ...
Defining requirements.
Single process in a fictitious hotel using data flow diagram notation.
Single use case in a fictitious hotel using use case diagram notation.
This approach helps the analyst to decompose the system into ‘mentally bite-sized’ mini-systems using events that require a planned response. The level of detail of each response is at the level of ‘primary use cases’. Each planned response may be modelled using DFD notation or as a single use case using use case diagram notation.
The basic flow within a process or use case can usually be described in a relatively small number of steps, often fewer than twenty or thirty, possibly using something like ‘structured English’. Ideally, all of the steps would be visible all at once (often a page or less). The intention is to reduce one of the risks associated with short-term memory, namely, forgetting what is not immediately visible (‘out of sight, out of mind’). ...
Single process in a fictitious hotel using data flow diagram notation." [Event partitioning. Wikipedia]
The DFD example "Last resort hotel book room process" was created using the ConceptDraw PRO diagramming and vector drawing software extended with the Data Flow Diagrams solution from the Software Development area of ConceptDraw Solution Park.
DFD

Data Flow Diagram Examples

Network Diagram Software Enterprise Private Network

SWOT Analysis Tool for Small Business

Bubble diagrams in Landscape Design with ConceptDraw DIAGRAM

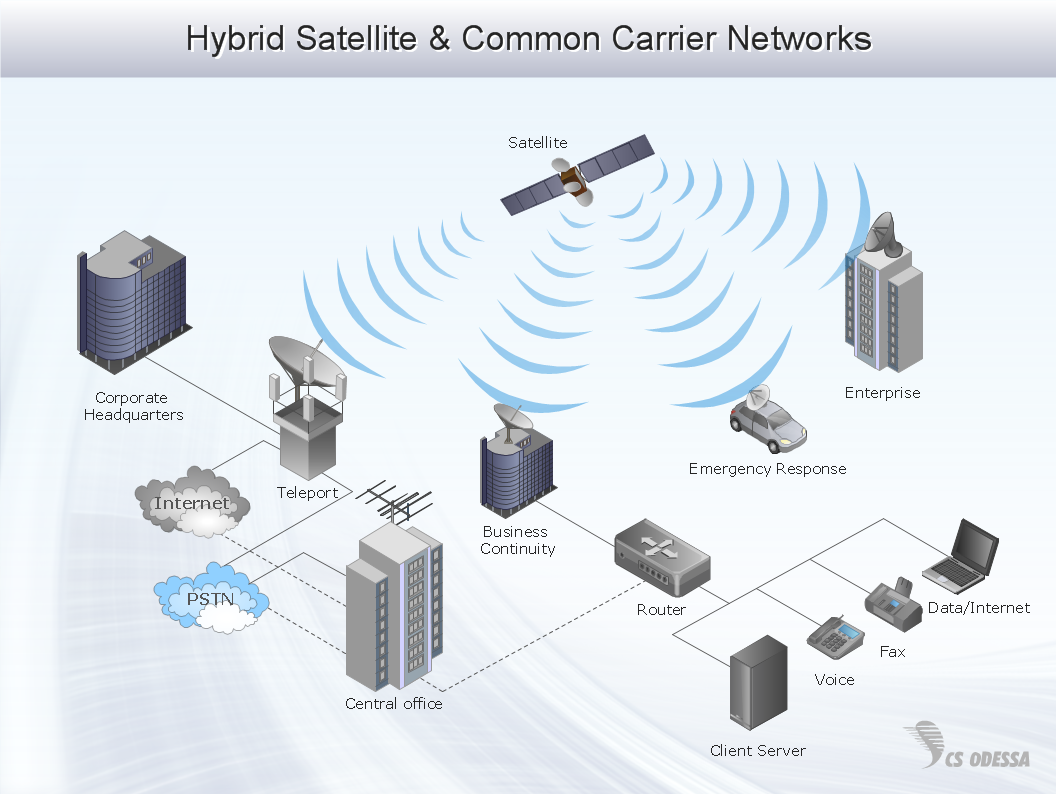
"Satellite television is television programming delivered by the means of communications satellite and received by an outdoor antenna, usually a parabolic reflector generally referred to as a satellite dish, and as far as household usage is concerned, a satellite receiver either in the form of an external set-top box or a satellite tuner module built into a TV set. Satellite TV tuners are also available as a card or a USB peripheral to be attached to a personal computer. In many areas of the world satellite television provides a wide range of channels and services, often to areas that are not serviced by terrestrial or cable providers.
Direct-broadcast satellite television comes to the general public in two distinct flavors - analog and digital. This necessitates either having an analog satellite receiver or a digital satellite receiver. Analog satellite television is being replaced by digital satellite television and the latter is becoming available in a better quality known as high-definition television." [Satellite television. Wikipedia]
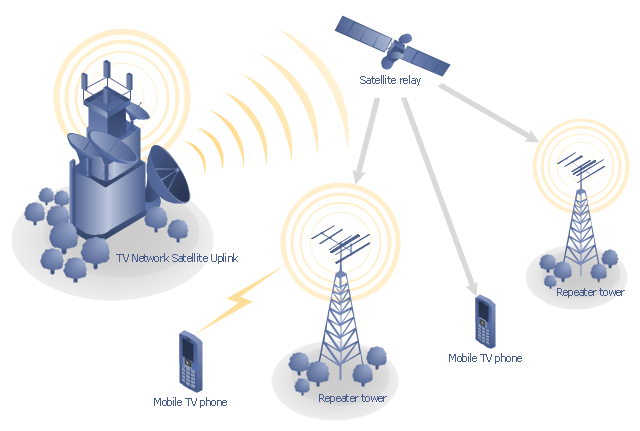
"Mobile television is television watched on a small handheld or mobile device. It includes pay TV service delivered via mobile phone networks or received free-to-air via terrestrial television stations. Regular broadcast standards or special mobile TV transmission formats can be used. Additional features include downloading TV programs and podcasts from the internet and the ability to store programming for later viewing. ...
Mobile TV is among the features provided by many 3G phones." [Mobile television. Wikipedia]
"MobiTV, Inc. ... is a provider of end-to-end mobile media solutions. In 2011, the cloud-based MobiTV converged media platform delivered 1.6 billion minutes of live TV, video-on-demand and downloaded content for offline viewing to all tier-one wireless carriers and major mobile operating systems in the United States. ...
MobiTV furnishes programming from more than 40 television channels, offering live news and sports and a variety of full-episode on-demand shows for streaming or download on mobile devices, tablets, personal computers and other Internet-enabled consumer electronics.
MobiTV-powered TV services, which carry the operator’s brand, are accessible on hundreds of devices across multiple wireless carrier partners. ...
MobiTV’s converged media platform is an end-to-end managed service comprising components that work together to securely manage, deliver and play back video across devices both inside and outside the home." [MobiTV. Wikipedia]
This mobile satellite TV network diagram example was created using the ConceptDraw PRO diagramming and vector drawing software extended with the Telecommunication Network Diagrams solution from the Computer and Networks area of ConceptDraw Solution Park.
Direct-broadcast satellite television comes to the general public in two distinct flavors - analog and digital. This necessitates either having an analog satellite receiver or a digital satellite receiver. Analog satellite television is being replaced by digital satellite television and the latter is becoming available in a better quality known as high-definition television." [Satellite television. Wikipedia]
"Mobile television is television watched on a small handheld or mobile device. It includes pay TV service delivered via mobile phone networks or received free-to-air via terrestrial television stations. Regular broadcast standards or special mobile TV transmission formats can be used. Additional features include downloading TV programs and podcasts from the internet and the ability to store programming for later viewing. ...
Mobile TV is among the features provided by many 3G phones." [Mobile television. Wikipedia]
"MobiTV, Inc. ... is a provider of end-to-end mobile media solutions. In 2011, the cloud-based MobiTV converged media platform delivered 1.6 billion minutes of live TV, video-on-demand and downloaded content for offline viewing to all tier-one wireless carriers and major mobile operating systems in the United States. ...
MobiTV furnishes programming from more than 40 television channels, offering live news and sports and a variety of full-episode on-demand shows for streaming or download on mobile devices, tablets, personal computers and other Internet-enabled consumer electronics.
MobiTV-powered TV services, which carry the operator’s brand, are accessible on hundreds of devices across multiple wireless carrier partners. ...
MobiTV’s converged media platform is an end-to-end managed service comprising components that work together to securely manage, deliver and play back video across devices both inside and outside the home." [MobiTV. Wikipedia]
This mobile satellite TV network diagram example was created using the ConceptDraw PRO diagramming and vector drawing software extended with the Telecommunication Network Diagrams solution from the Computer and Networks area of ConceptDraw Solution Park.
Mobile satellite TV diagram
Mini Hotel Floor Plan. Floor Plan Examples

Cisco Switches and Hubs. Cisco icons, shapes, stencils and symbols

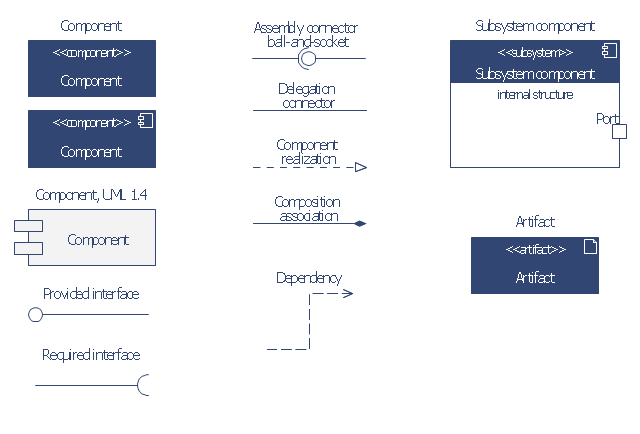
The vector stencils library "Bank UML component diagram" contains 13 shapes for drawing UML component diagrams.
Use it for object-oriented modeling of your bank information system.
"A component is something required to execute a stereotype function. Examples of stereotypes in components include executables, documents, database tables, files, and library files.
Components are wired together by using an assembly connector to connect the required interface of one component with the provided interface of another component. This illustrates the service consumer - service provider relationship between the two components. ...
When using a component diagram to show the internal structure of a component, the provided and required interfaces of the encompassing component can delegate to the corresponding interfaces of the contained components. ...
Symbols.
This may have a visual stereotype in the top right of the rectangle of a small rectangle with two even smaller rectangles jutting out on the left.
The lollipop, a small circle on a stick represents an implemented or provided interface. The socket symbol is a semicircle on a stick that can fit around the lollipop. This socket is a dependency or needed interface." [Component diagram. Wikipedia]
This example of UML component diagram symbols for the ConceptDraw PRO diagramming and vector drawing software is included in the ATM UML Diagrams solution from the Software Development area of ConceptDraw Solution Park.
UML component diagram symbols
This SWOT matrix diagram example was created on the base of article "An Easy Way To Jumpstart Your Strategic Plan: SWOT" by Leslie Wolf from the website of the California Digital Library, the University of California. "Strategic planning doesn’t have to be a daunting and lengthy process. The goal is really a simple one: to help you understand your world and build a road map to guide your efforts. ...
This analysis tool can help you focus your attention on the specific success factors that are right for your team.
The tool is called a SWOT analysis. SWOT stands for Strengths and Weaknesses, Opportunities and Threats. Here’s what it means:
(1) Strengths are those positive internal attributes that strengthen your business or team. You can develop plans to capitalize on those strengths.
(2) Weaknesses are those negative internal attributes that are working against your success. You can shore up those weaknesses so they don’t stop your success.
(3) Opportunities are those external conditions that can have a positive effect on your goals. These opportunities can point you in the right direction.
(4) Threats are those external conditions that can have a negative effect on your goals. These threats will affect you less if you can identify and minimize them. ...
We thought it would be helpful to show you a sample SWOT analysis for a business you can easily visualize: a small independent bookstore in a university town. The store owner brought the team together to think about how the bookstore could survive during the continuing financial downturn. After an hour of brainstorming, this is the SWOT analysis they developed." [cdlib.org/ cdlinfo/ 2010/ 09/ 29/ an-easy-way-to-jumpstart-your-strategic-plan-swot/ ]
The matrix diagram example "SWOT analysis for a small independent bookstore" was created using the ConceptDraw PRO diagramming and vector drawing software extended with the SWOT Analysis solution from the Management area of ConceptDraw Solution Park.
SWOT matrix

 Office Layout Plans
Office layouts and office plans are a special category of building plans and are often an obligatory requirement for precise and correct construction, design and exploitation office premises and business buildings. Designers and architects strive to make office plans and office floor plans simple and accurate, but at the same time unique, elegant, creative, and even extraordinary to easily increase the effectiveness of the work while attracting a large number of clients.
HelpDesk
How to Create a BPMN Diagram

- Small Dfd Of Hotel Management System
- Small Hotel Plan Template
- Example For Small Data Flow Diagram
- Logical network topology diagram | Local area network (LAN ...
- Small Office Design | Active Directory Diagram | Campus Area ...
- Data Flow Diagram Symbols. DFD Library | Last resort hotel book ...
- Data Flow Diagram Model | DFD - Model of small traditional ...
- Small Hotel Plans And Designs
- Data Flow Diagrams (DFD) | Office Layout Plans | Hotel Network ...
- Hotel Network Topology Diagram . Hotel Guesthouse WiFi Network ...
- Network Topologies | Tree Network Topology Diagram | Fully ...
- Data Flow Diagram Model | DFD - Model of small traditional ...
- Data Flow Diagrams (DFD) | Hotel Network Topology Diagram ...
- Data Flow Diagram Process | Data Flow Diagram | Last resort hotel ...
- Office Import Network Diagram Tool
- Small Office Network Setup Diagram
- Small Hotel Plan With Dimensions
- Data Flow Diagram Symbols. DFD Library | Last resort hotel book ...
- Mini Hotel Floor Plan. Floor Plan Examples | Create Floor Plans ...
- Hotel Network Topology Diagram