Marketing and Sales Organization chart. Organization chart Example

HelpDesk
How to Create a Sales Flowchart

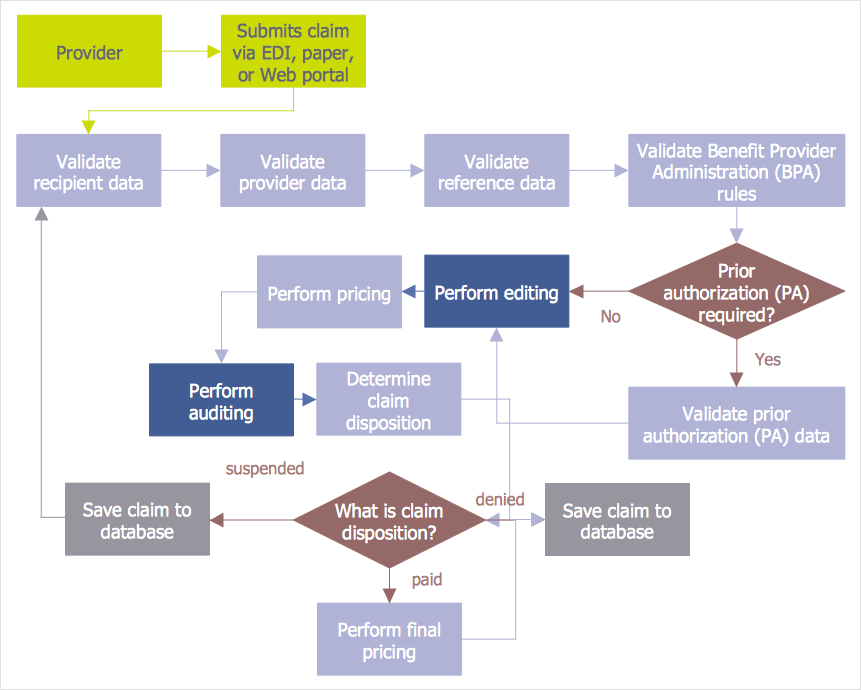
 Cross-Functional Flowcharts
Cross-functional flowcharts are powerful and useful tool for visualizing and analyzing complex business processes which requires involvement of multiple people, teams or even departments. They let clearly represent a sequence of the process steps, the order of operations, relationships between processes and responsible functional units (such as departments or positions).
 ConceptDraw Solution Park
ConceptDraw Solution Park collects graphic extensions, examples and learning materials
 Accounting Flowcharts
Accounting Flowcharts solution extends ConceptDraw DIAGRAM software with templates, samples and library of vector stencils for drawing the accounting flow charts.
HelpDesk
How to Create the Custom Diagram Template
How to Create a Social Media DFD Flowchart

HelpDesk
How to Create an Accounting Flowchart

 Sales Flowcharts
The Sales Flowcharts solution lets you create and display sales process maps, sales process workflows, sales steps, the sales process, and anything else involving sales process management.
Business diagrams & Org Charts with ConceptDraw DIAGRAM


HelpDesk
How to Create an Audit Flowchart
HelpDesk
How to Create a Cross-Functional Flowchart

HelpDesk
How to Create Flowchart Using Standard Flowchart Symbols
HelpDesk
How to Draw a Process Flow Diagram

HelpDesk
How to Create a Cross-Functional Flowchart Using ConceptDraw Solution

HelpDesk
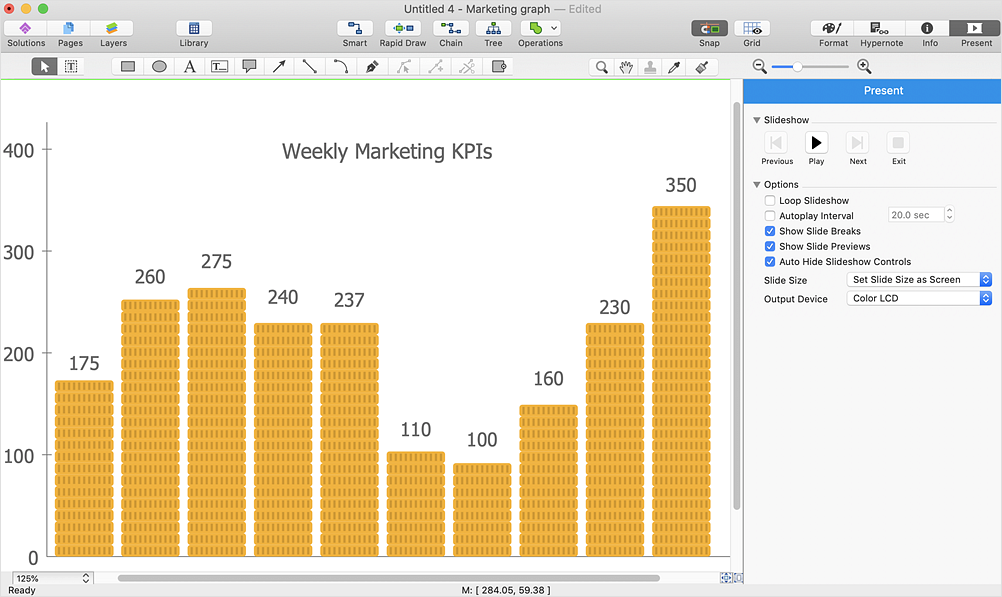
How to Create a Sales Dashboard

HelpDesk
How to Create Multipage Diagram From a Single Page Template
HelpDesk
How to Create a Time Series Dashboard

HelpDesk
How to Create a Data Flow Diagram

Sales Process Steps

- Sales Process Flowchart . Flowchart Examples | Marketing and Sales ...
- Sales Process Flowchart . Flowchart Examples | Accounting ...
- Sales Process Flowchart . Flowchart Examples | How to Create a ...
- Cross-Functional Flowcharts | Types of Flowchart - Overview ...
- Cross-Functional Flowcharts | Sales Process Flowchart . Flowchart ...
- How to Draw a Flowchart | Basic Flowchart Symbols | Opportunity ...
- Cross-Functional Flowcharts | Cross-Functional Flowchart
- Accounting Flowcharts | Cross-Functional Flowcharts | Sales ...
- Flowchart Examples and Templates | Audit process flowchart ...
- Sales Process Flowchart . Flowchart Examples | Process Flowchart ...
- Purchase Process Flow Chart . Accounting Flowchart Example ...
- Flowchart Marketing Process . Flowchart Examples | Selecting ...
- Sales Process Flowchart . Flowchart Examples
- Types of Flowchart - Overview | Flowcharts | Purchase Process Flow ...
- Flowchart Example: Flow Chart of Marketing Analysis
- How to Create a Social Media DFD Flowchart | Business diagrams ...
- Purchase Process Flow Chart . Accounting Flowchart Example | Flow ...
- Process Flowchart
- Sales Dashboard | Sales Process Flowchart . Flowchart Examples ...
- Cross-Functional Flowchart | Flowchart Software | Sales Process ...