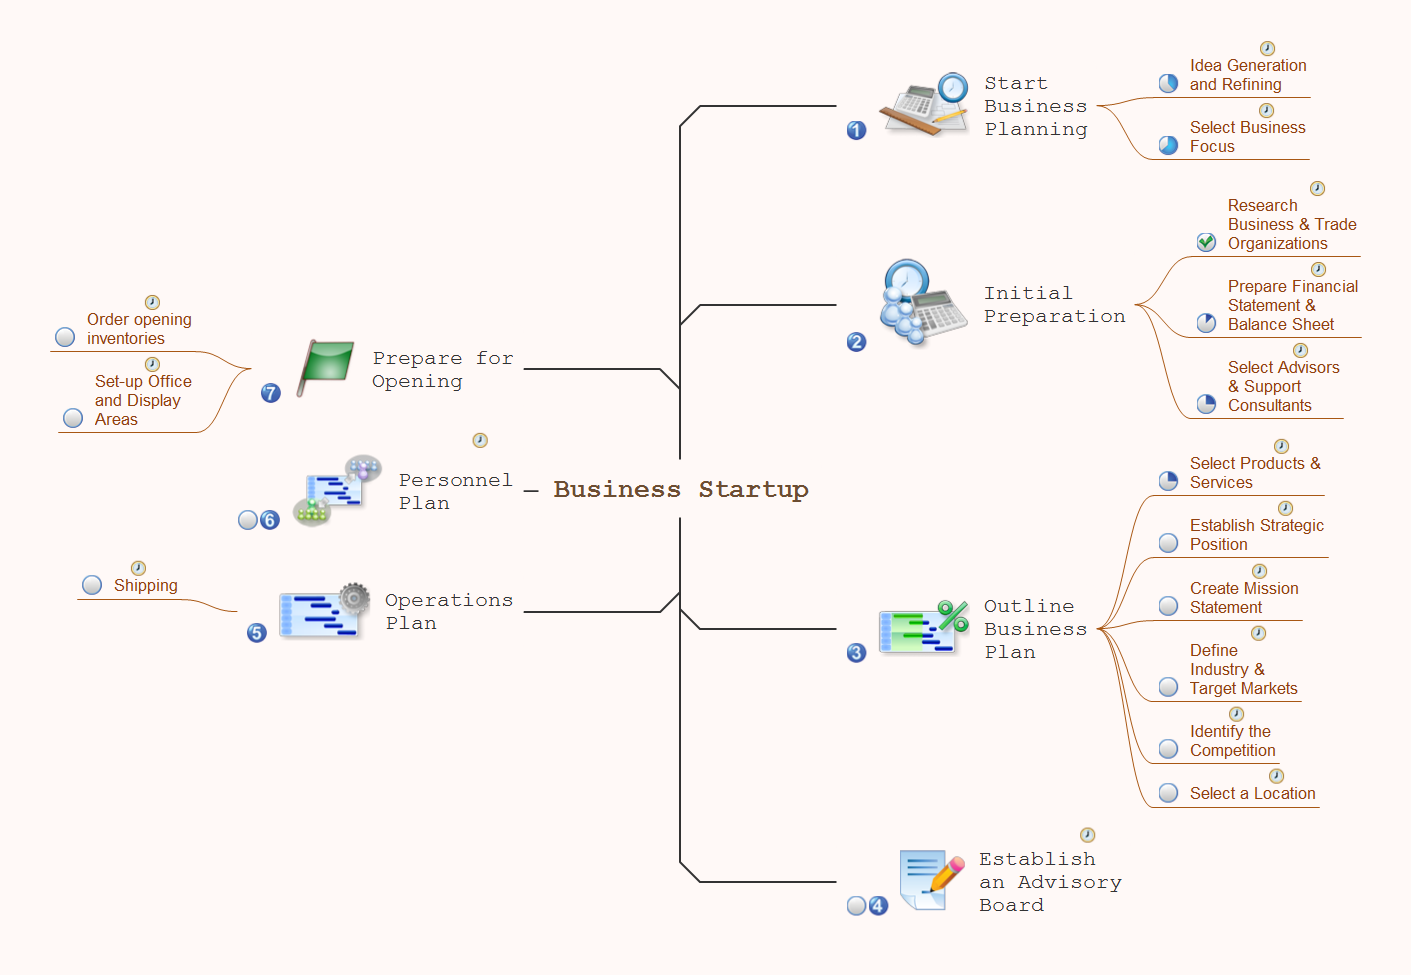
Demonstrating Results

How To Use Skype for Business

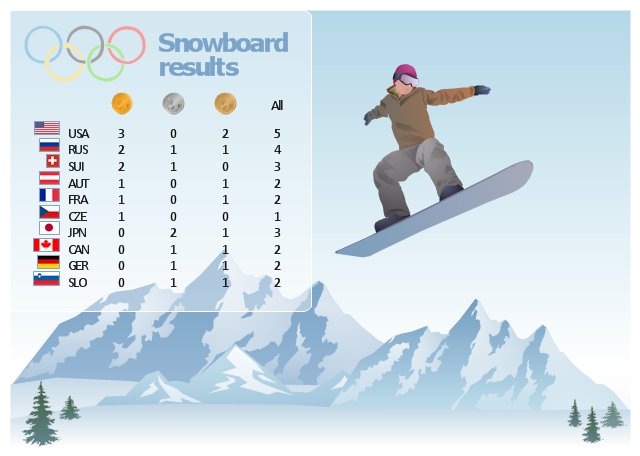
"Snowboarding at the 2014 Winter Olympics in Sochi was held at the Rosa Khutor Extreme Park. The events were held between 6 and 22 February 2014. A total of ten snowboarding events were held at Sochi 2014 which include parallel giant slalom, snowboard cross, half-pipe, and the new events of parallel slalom and slopestyle.
A crash in practice from Norwegian slopestyle snowboarder Torstein Horgmo, who fractured his collarbone, and complaints from other athletes that some jumps were too steep have prompted organizers to modify the slopestyle course in the week before the Games." [Snowboarding at the 2014 Winter Olympics. Wikipedia]
The sport infographics and medal table example "Sochi 2014 Winter Olympics ® - Snowboarding results" was created using the ConceptDraw PRO diagramming and vector drawing software extended with the Winter Sports solution from the Sport area of ConceptDraw Solution Park.
Medal table
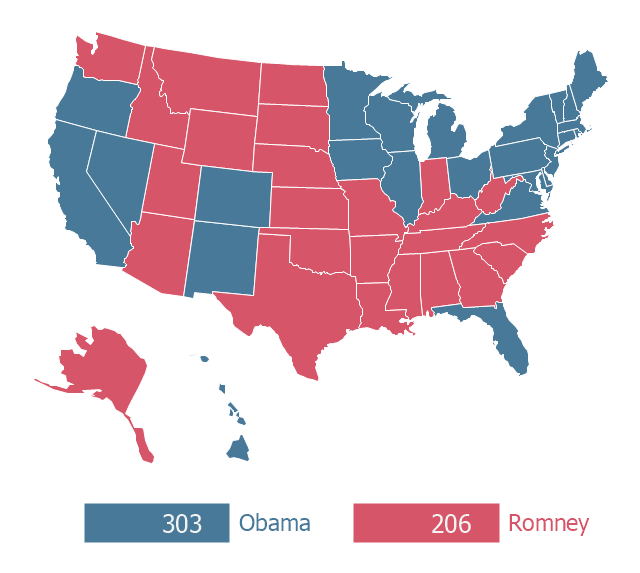
"The election of the President and the Vice President of the United States is an indirect vote in which citizens cast ballots for a slate of members of the U.S. Electoral College; these electors in turn directly elect the President and Vice President. Presidential elections occur quadrennially (the count beginning with the year 1792) on Election Day, the Tuesday between November 2 and 8, coinciding with the general elections of various other federal, states and local races. The most recent was the 2012 election, held on November 6. The next election will be the 2016 election, which will be held on November 8, 2016." [United States presidential election. Wikipedia]
This U.S.A. thematic map was redesigned from Wikipedia file: 2012 U.S. Presidential Election Results.jpg. [commons.wikimedia.org/ wiki/ File:2012_ U.S._ Presidential_ Election_ Results.jpg]
This file is licensed under the Creative Commons Attribution-Share Alike 3.0 Unported license.
[creativecommons.org/ licenses/ by-sa/ 3.0/ deed.en]
This U.S. thematic map example was created using ConceptDraw PRO diagramming and vector drawing software extended with Continent Maps solution from Maps area of ConceptDraw Solution Park.
Thematic map - 2012 US presidential election
 PM Meetings
PM Meetings solution extends ConceptDraw MINDMAP software with special tools, features, and templates, making the preparation for meetings of different orientation a quick and simple task, and allowing the project managers, team leaders, management specialists, and meeting organizers the capability to prepare easily and quickly for regular project meetings using solution's templates, to brainstorm ideas, to record brainstorming results, to keep the meetings on track, and to share meeting results immediately and without efforts. The meetings become more efficient because of the ability to easily record results, the collaborative team decisions are captured as a part of the meeting process, the meeting notes are easily distributed at a meeting’s conclusion to all participants and stakeholders.
Use Case Diagrams technology with ConceptDraw DIAGRAM

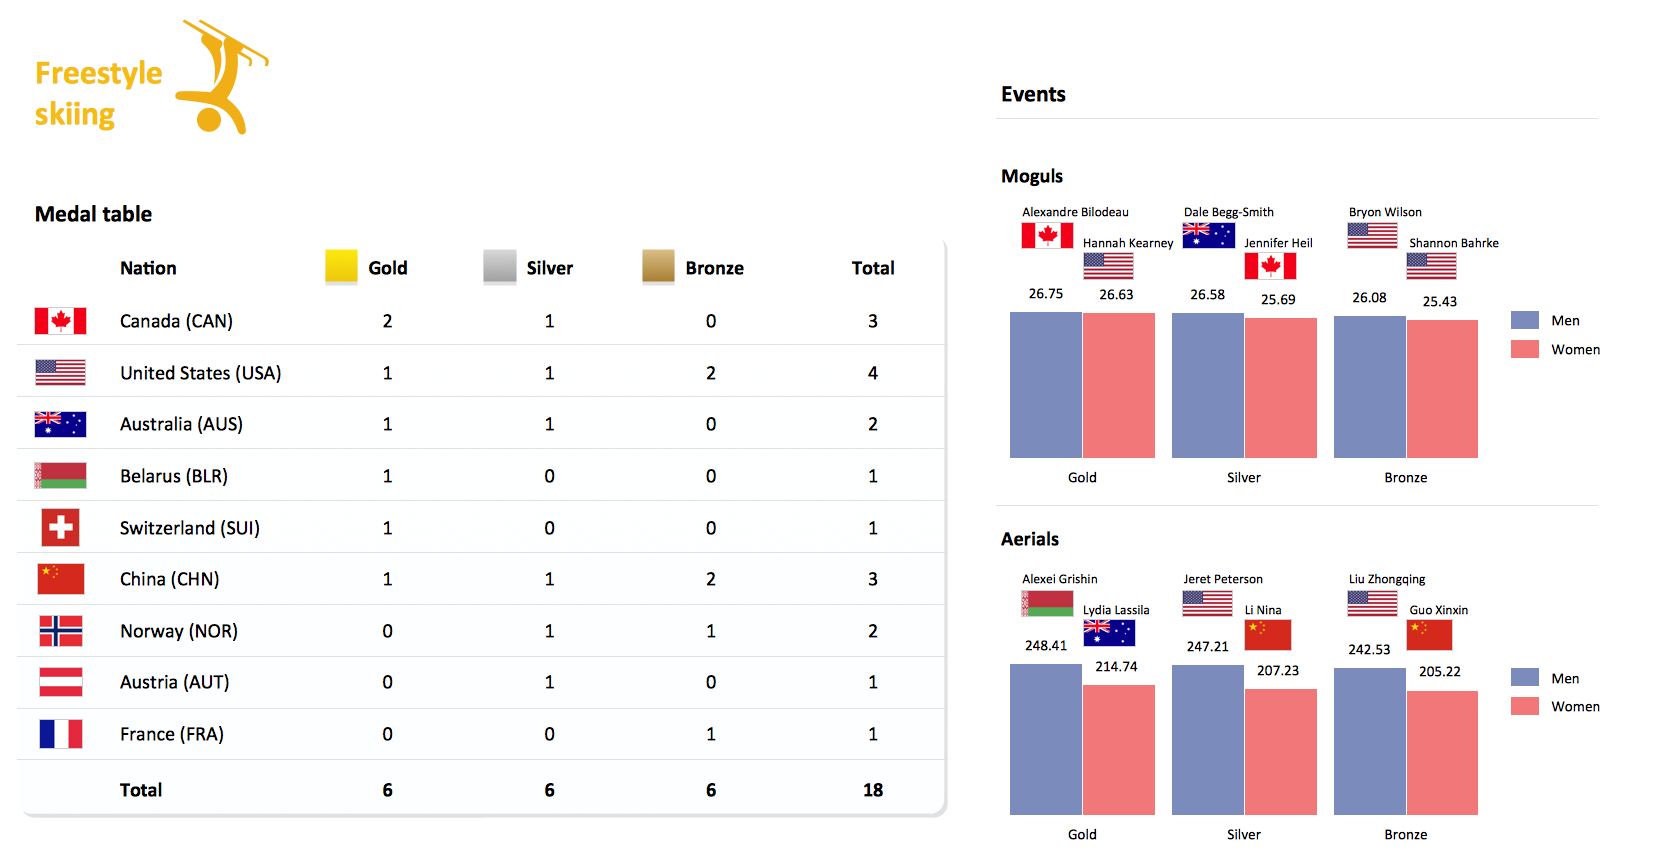
Winter Sports. Olympic Games Illustrations. Medal Summary
Garrett IA Diagrams with ConceptDraw DIAGRAM

 Business Productivity Area
Business Productivity Solutions extend ConceptDraw products with tools for making presentations, conducting meetings, preparing documents, brainstorming, or building new strategies.
Software for Creating SWOT Analysis Diagrams

PROBLEM ANALYSIS. Relations Diagram


 Marketing
This solution extends ConceptDraw DIAGRAM and ConceptDraw MINDMAP with Marketing Diagrams and Mind Maps (brainstorming, preparing and holding meetings and presentations, sales calls).
 Spatial Infographics
Spatial infographics solution extends ConceptDraw DIAGRAM software with infographic samples, map templates and vector stencils libraries with design elements for drawing spatial information graphics.
Collaboration in a Project Team

Total Quality Management with ConceptDraw

- Demonstrating Results | Personal Memory Assistant |
- Collaboration in a Project Team | Demonstrating Results | How To ...
- Personal Memory Assistant | Demonstrating Results | ConceptDraw ...
- How to Simplify Flow Charting Cross-functional Flowchart ...
- Business Processes | Basic Diagramming | Create Flow Chart on Mac |
- Cross-Functional Flowcharts | Accounting Flowcharts | Create Flow ...
- Boston growth-share matrix template
- Collaboration Area | Professional & Powerful Mind Mapping ...
- How To Do A Mind Map In Powerpoint | How to Use the Export To ...
- How To Make an Effective PowerPoint Presentation
- Sochi 2014 Olympics - Men's hockey tournament schedule ...
- Cross-Functional Flowcharts | Purchase Process Flow Chart ...
- Deployment chart template | SWOT Analysis Solution - Strategy ...
- Best Flowchart Software | Use the Best FlowChart Tool for the Job ...
- Winter Olympics
- PM Planning | Collaboration in a Project Team | Program for Making ...
- How To Make an Effective PowerPoint Presentation | Program for ...
- Types of Flowchart - Overview | Business Flowchart Generation with ...
- Flowchart - Product life cycle process | Good Flow Chart app for Mac ...
- How To Make an Effective PowerPoint Presentation | How To Do A ...