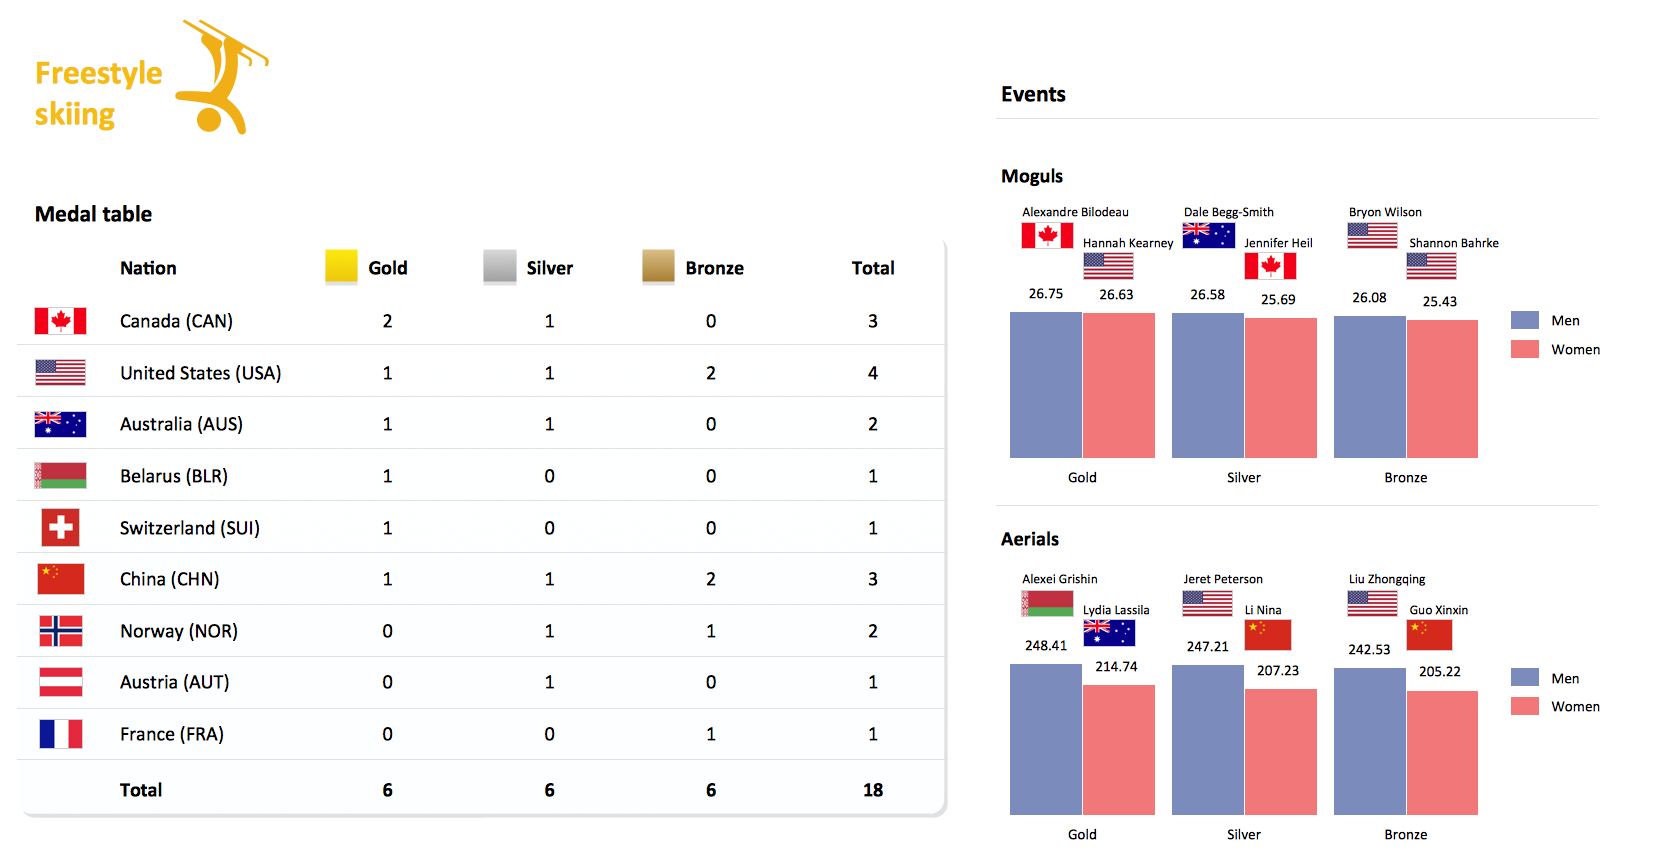
Sample 1. Medal Summary Freestyle Skiing at the 2010 Winter Olympics
The Winter Sports solution from Sport Area of ConceptDraw Solution Park contains winter sports illustrations and diagram examples, templates, and vector sport pictogram libraries.
This example was created in ConceptDraw DIAGRAM using the 'Winter Sports Symbols' library, from our Winter Sports Solution. An experienced user spent 15 minutes creating this sample.
Using a visual format for Olympic Game results lets you compare the competing countries results in sports competitions. This is a good way to illustrate your analysis and share it.
NINE RELATED HOW TO's:
From all the auxiliary business process tools, SWOT analysis always remains in the top place. It is difficult to answer what SWOT Analysis is in marketing in several paragraphs. This is a very powerful tool to understand all the circumstance of your business, it is important part of small business project management.
This SWOT analysis was carried out to discover strengths and weaknesses of the marketing strategy, as well as identify its opportunities. This SWOT diagram (matrix) was drawn in Conceptdraw DIAGRAM using its SWOT and TOWS Diagrams solution. Investigations of all constituents of a certain case will assist in considering strategy statements and during and making a decision. The SWOT analysis is the good tool for specifying marketing objectives discovering external and internal influences on accomplishing marketing objectives, this is critical tool for small business project management. ConceptDraw Office suite delivers SWOT diagram samples and tools in illustrative part of marketing project management software and project report software.
Picture: What is SWOT Analysis in Marketing
Nodes of any computer network are somehow organized in a hierarchy or a layout. Some of the common layouts like star network topology are more reliable and some like ring topology withstand high loads better. It is also important to distinguish logical topologies from physical.
This diagram represents a typical view of the star network topology. The star network topology is one of the most frequently used network topologies in the majority of office and home networks. It is very popular because of its low cost and the easy maintenance. The plus of the star network topology is that if one computer on the local network is downed, this means that only the failed computer can not send or receive data. The other part of the network works normally. The minus of using star network topology is that all computers are connected to a single point-switch, or hub. Thus, if this equipment goes down, the whole local network comes down.
Picture: Star Network Topology
Related Solution:
ConceptDraw DIAGRAM drawing software offers the best infographic tools - Data-driven Infographics Solution.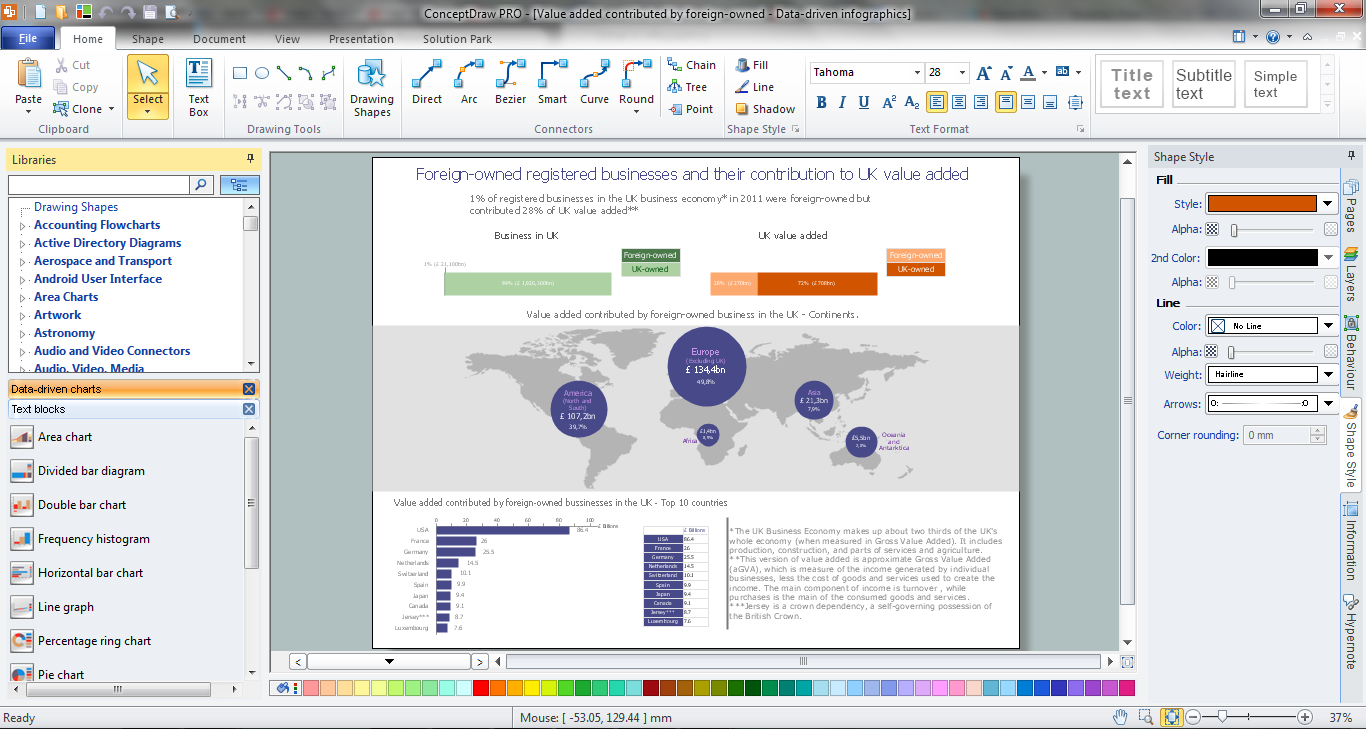
Picture: Infographic Tools
Related Solution:
Visual depiction is key secret to successful understanding baseball strike zone dimentions. Baseball strike zone diagram illustrated using ConceptDraw DIAGRAM software enhanced with the Baseball solution.
Picture: Baseball — Pitching and the Strike Zone
Related Solution:
Thanks to the Soccer solution you can design your own soccer-related drawings, diagrams, schemes in seconds. It’s very simple and convenient because Soccer solution contains incredible quantity of ready-to-use predesigned vector objects, professional templates and samples.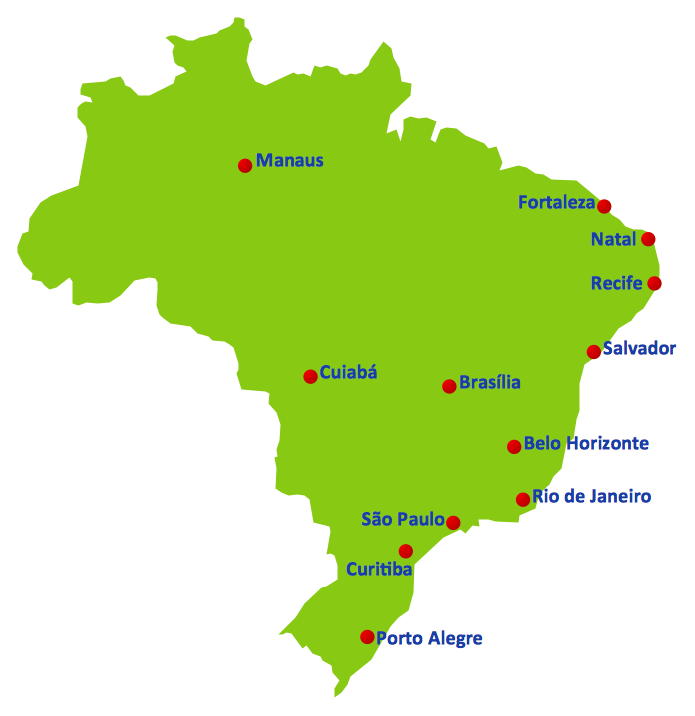
Picture: 2014 FIFA World Cup
Related Solution:
To be an expert in American Football this is not enough to know rules, you should also know at least basic offenses and defenses. Getting closer with this kind of knowledge you may find visual football diagrams an extremely helpful. The Football solution for ConceptDraw DIAGRAM gives you a perfect tool for drawing football diagrams.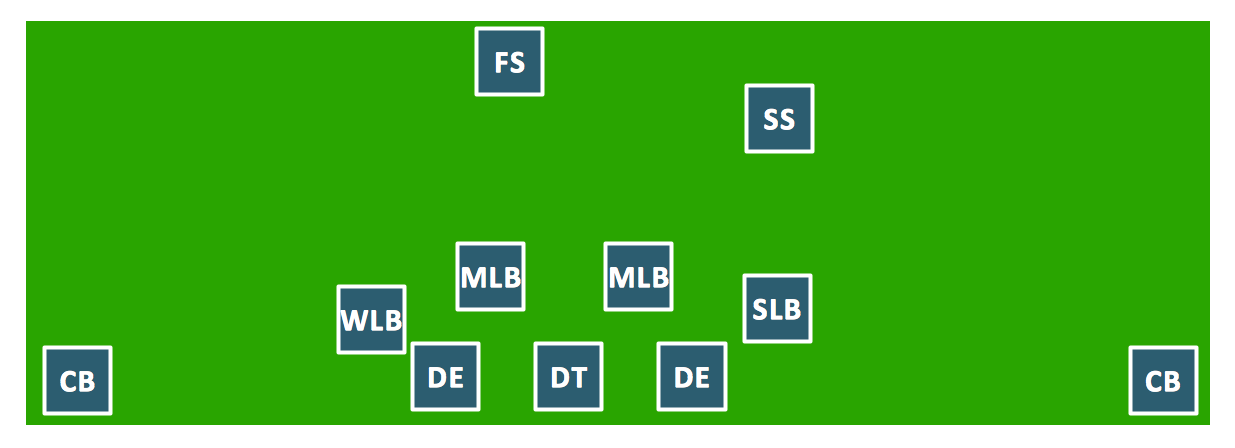
Picture: 3-4 Defense Diagram
Related Solution:
The Total Quality Management Diagram solution helps you and your organization visualize business and industrial processes. Create Total Quality Management diagrams for business process with ConceptDraw software.
Picture: Total Quality Management Value
Related Solution:
The SWOT Analysis solution from the Management area of ConceptDraw Solution Park contains set of examples, templates and vector design elements of SWOT and TOWS matrices. It helps you to quickly draw SWOT and TOWS analysis matrix diagrams using the best SWOT matrix software ConceptDraw DIAGRAM.
Picture: SWOT Matrix Software
Related Solution:
Subway infographic design elements of MetroMap and ConceptDraw software tools.
Picture: Subway infographic design elements - software tools
Related Solution: