
Sample 1. Mind map presentation - Career planning.
Presentation Exchange solution extends ConceptDraw MINDMAP software with the ability to import presentations from Microsoft PowerPoint, as well as enhancing its existing presentation capabilities.
With the Presentation Exchange solution you can easily extract the content from a PowerPoint presentation to see how it all fits together in a single view. You can review slide content, see how the slides support one another, and refine the story.
TEN RELATED HOW TO's:
Public catering business will always be in demand.To attract a lot of clients, it’s important to have a detailed banquet hall plan, a diverse menu and reasonable prices. If you want to create a good plan, you can use drawing software.
When planning and considering the layout of a banquet hall, one must take into consideration, that it is very significant to make it stylish with correctly selected appointment and celebratory belongings. Tables and seating must be handily arranged. The furniture arrangement can changes depending on client requirements, kind of banquet and amount of guests. ConceptDraw Cafe and Restaurant Plans solution supplies a dozens of predesigned vector graphic objects of banquet furniture and accessories. Thus you can design the Banquet Hall layout for the celebrations in any style and any number of guests.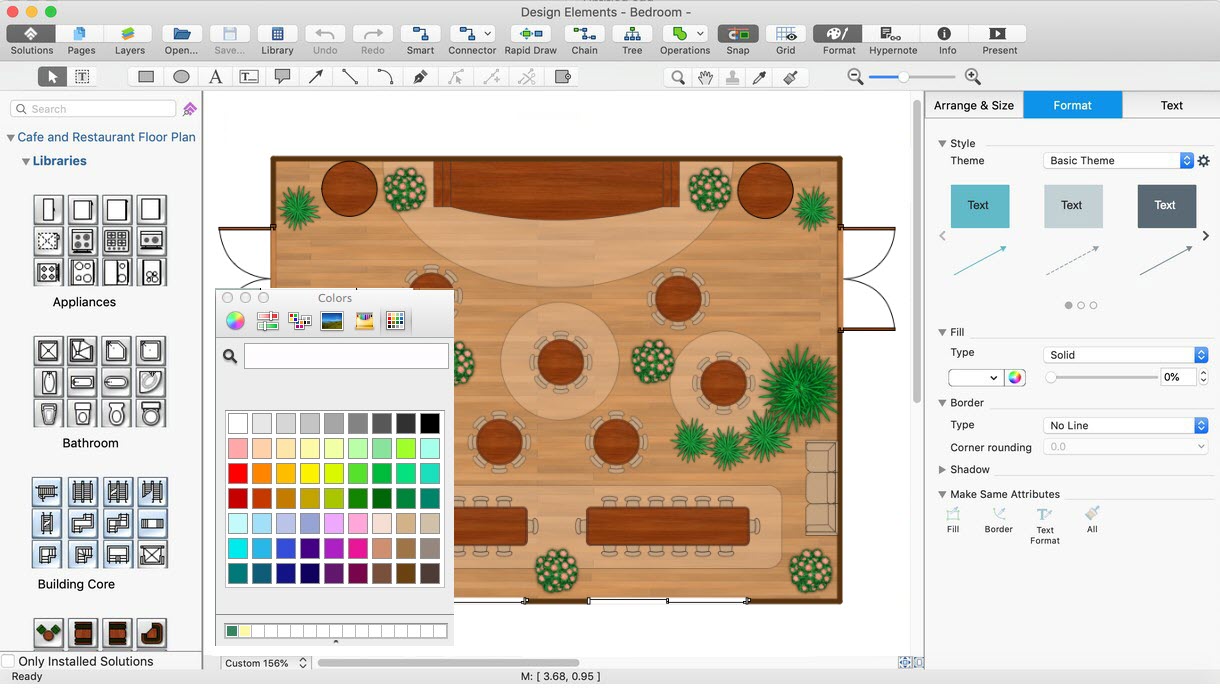
Picture: Banquet Hall Plan Software
Related Solution:
Activity Network Diagram - This sample was created in ConceptDraw DIAGRAM diagramming and vector drawing software using the Seven Management and Planning Tools solution from the Management area of ConceptDraw Solution Park.
This sample shows the PERT (Program Evaluation Review Technique) chart of the request on proposal. A request for proposal (RFP) is a request of the company or the organization to potential suppliers to submit the business proposals for service or goods that it is interested to purchase. The RFP is represented on the initial procurement stage and allows to define the risks and benefits.
Picture: Activity Network Diagram Method
Related Solution:
Communication is the main challenge and the key success factor for remote project management. Communicating visually via Skype you bring all team and customers onto the one page.
Remote Presentation for Skype solution for ConceptDraw MINDMAP helps communicate with remote team and customers in visual manner on wide range of issues. Using this solution for regular status meetings allows you to push your team on tasks and keep task statuses up to date.
Picture: Communication Tool for Remote Project Management
Related Solution:
Using Skype for Business will let you control teams and deliver information worldwide in a real-time. This is an important tool for everyday work.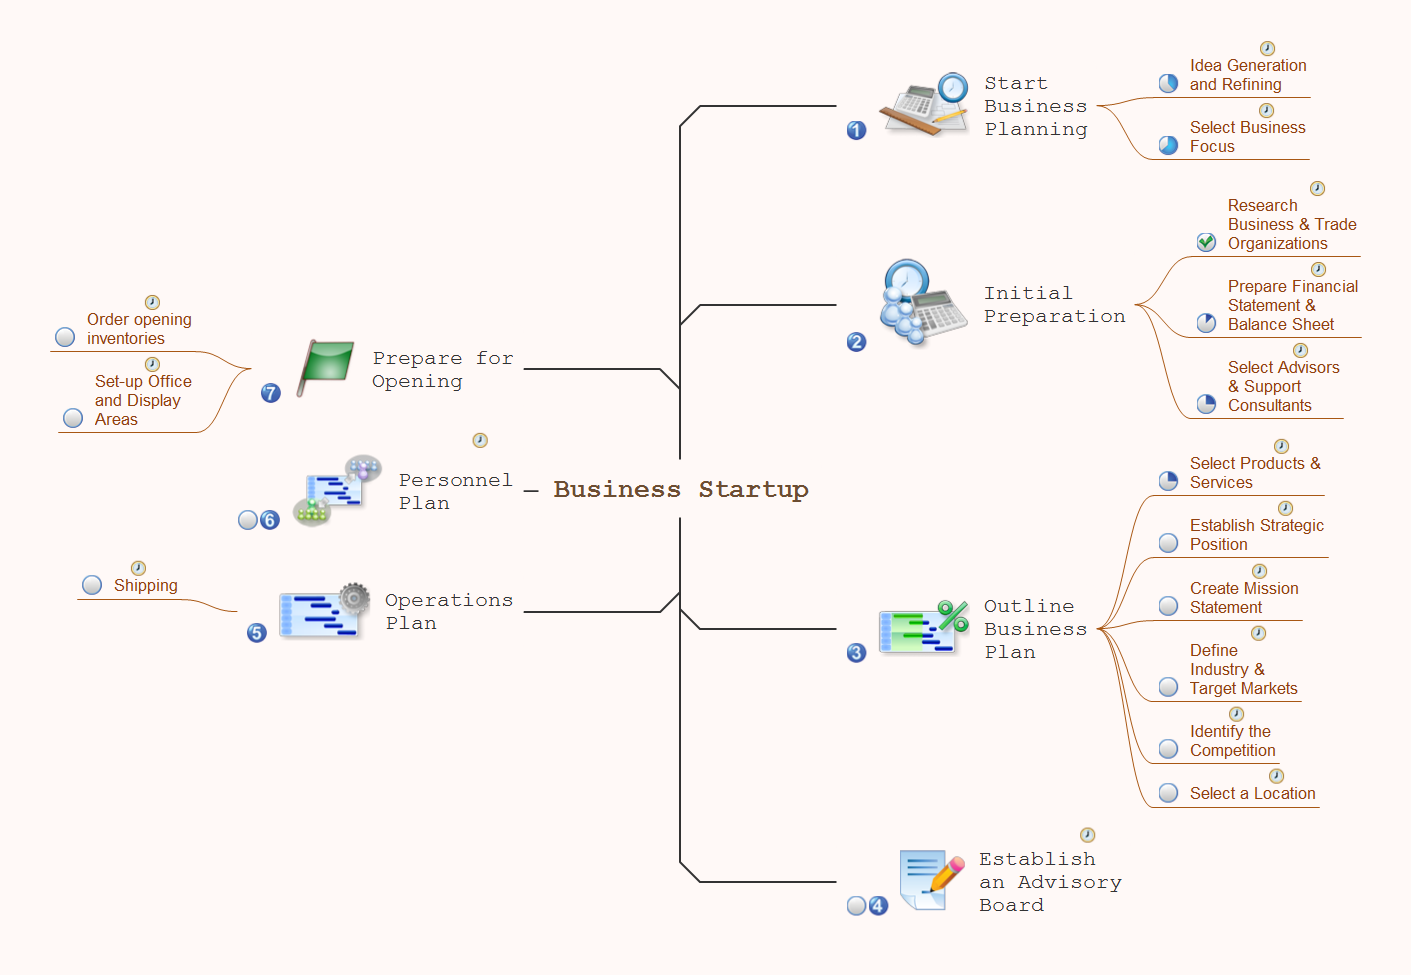
Picture: How To Use Skype for Business
Related Solution:
All information you send from ConceptDraw MINDMAP is indexed for you by Evernote, making information easy to find and use.
Picture: Evernote exchange - Personal Productivity
Related Solution:
This sample shows the Strategic Plan of the Broadband Lifecycle that was developed by Strategic Networks Group. The Broadband Lifecycle represents the advance of the broadband investments.
Picture: Successful Strategic Plan
No need for any special drawing skills to create professional looking diagrams outside of your knowledge base. ConceptDraw DIAGRAM takes care of the technical details, allowing you to focus on your job, not the drawing.
ConceptDraw DIAGRAM delivers full-functioned alternative to MS Visio. ConceptDraw DIAGRAM supports import of Visio files. ConceptDraw DIAGRAM supports flowcharting, swimlane, orgchart, project chart, mind map, decision tree, cause and effect, charts and graphs, and many other diagram types.
Picture: MS Visio Look a Like Diagrams
ConceptDraw MINDMAP - an excellent tool for exporting mind maps to PowerPoint to visualize and presenting your project. You can simply generate, change, update your mindmap and then make a presentation in PowerPoint.
Picture: How To Do A Mind Map In PowerPoint
Related Solution:
Learn how to use ConceptDraw MINDMAP to create a simple presentation.
Picture: Create a Basic Presentation Quickly
Related Solution:
No matter where you are now, at home, in a public institution, or in office, and what kind of business you run, you could face an emergency at any moment. The emergencies are caused by hazardous materials or by disasters. You should be prepared for any of them in advance and you need an Emergency or Evacuation Plan. ConceptDraw DIAGRAM software extended with Fire and Emergency Plans solution includes a large collection of pre-made samples. Any of these plans suits for use as a free Evacuation Floor Plan template for the creation of special documentation and instructions according to the actions during fires and emergencies.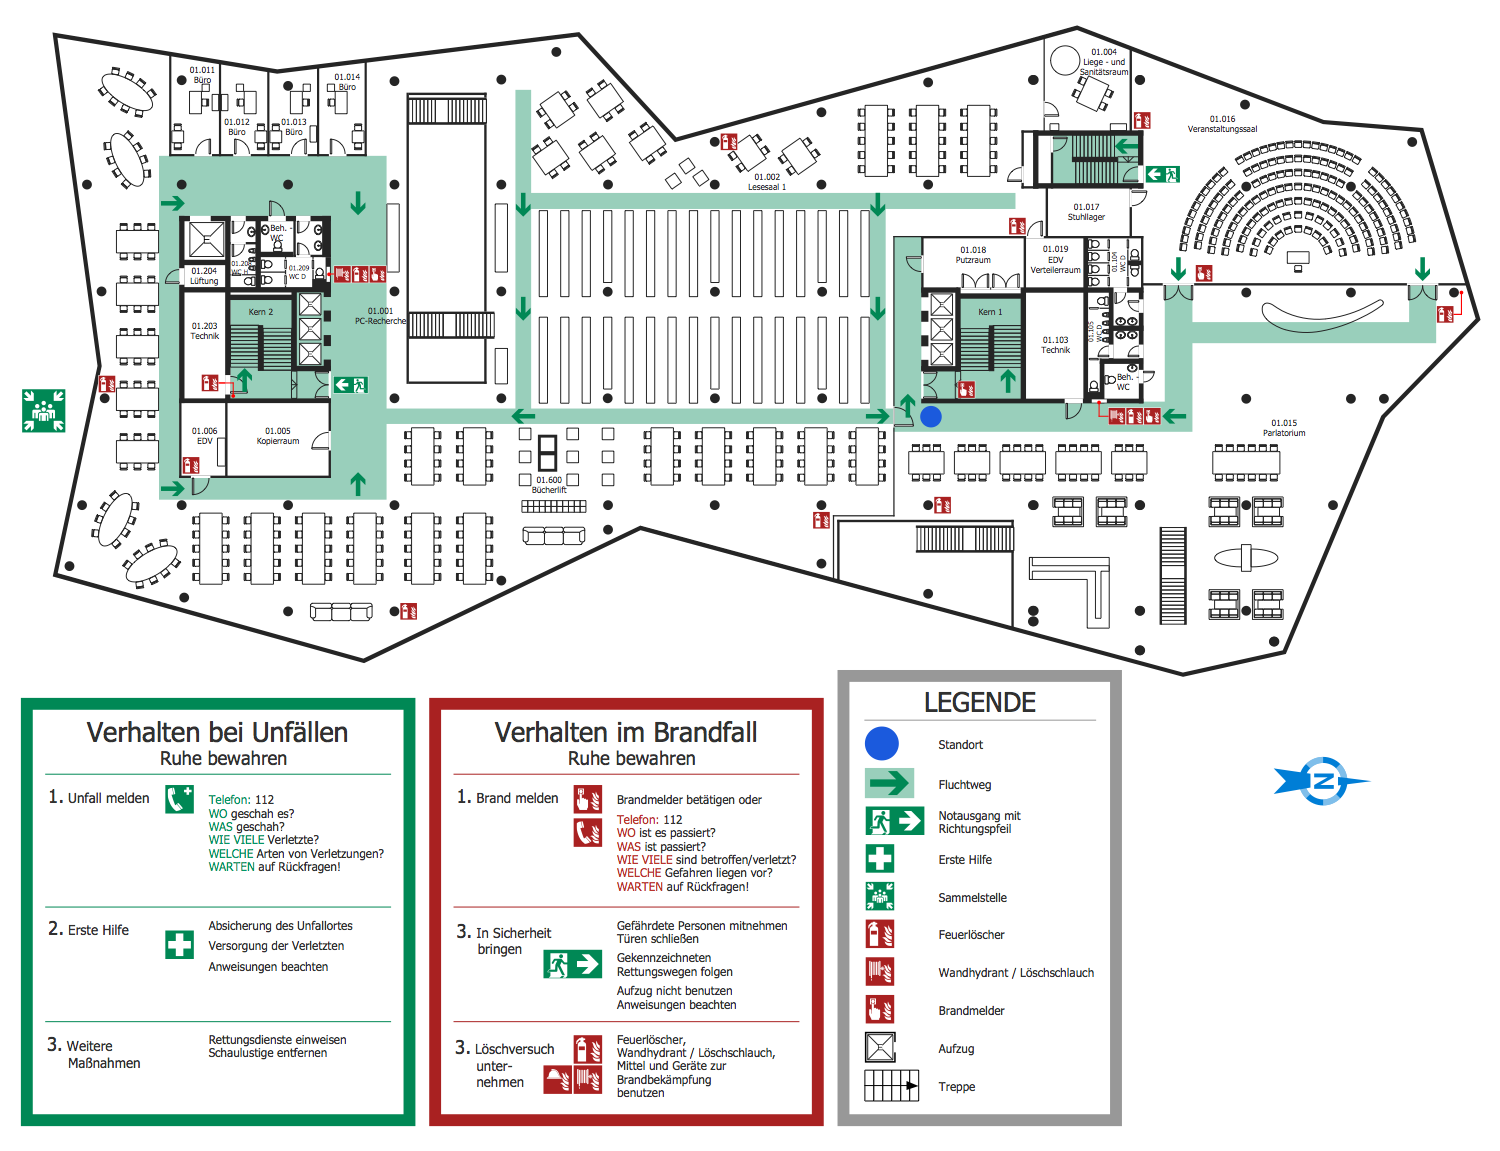
Picture: Free Evacuation Floor Plan Template
Related Solution: