Work Order Process Flowchart. Business Process Mapping Examples

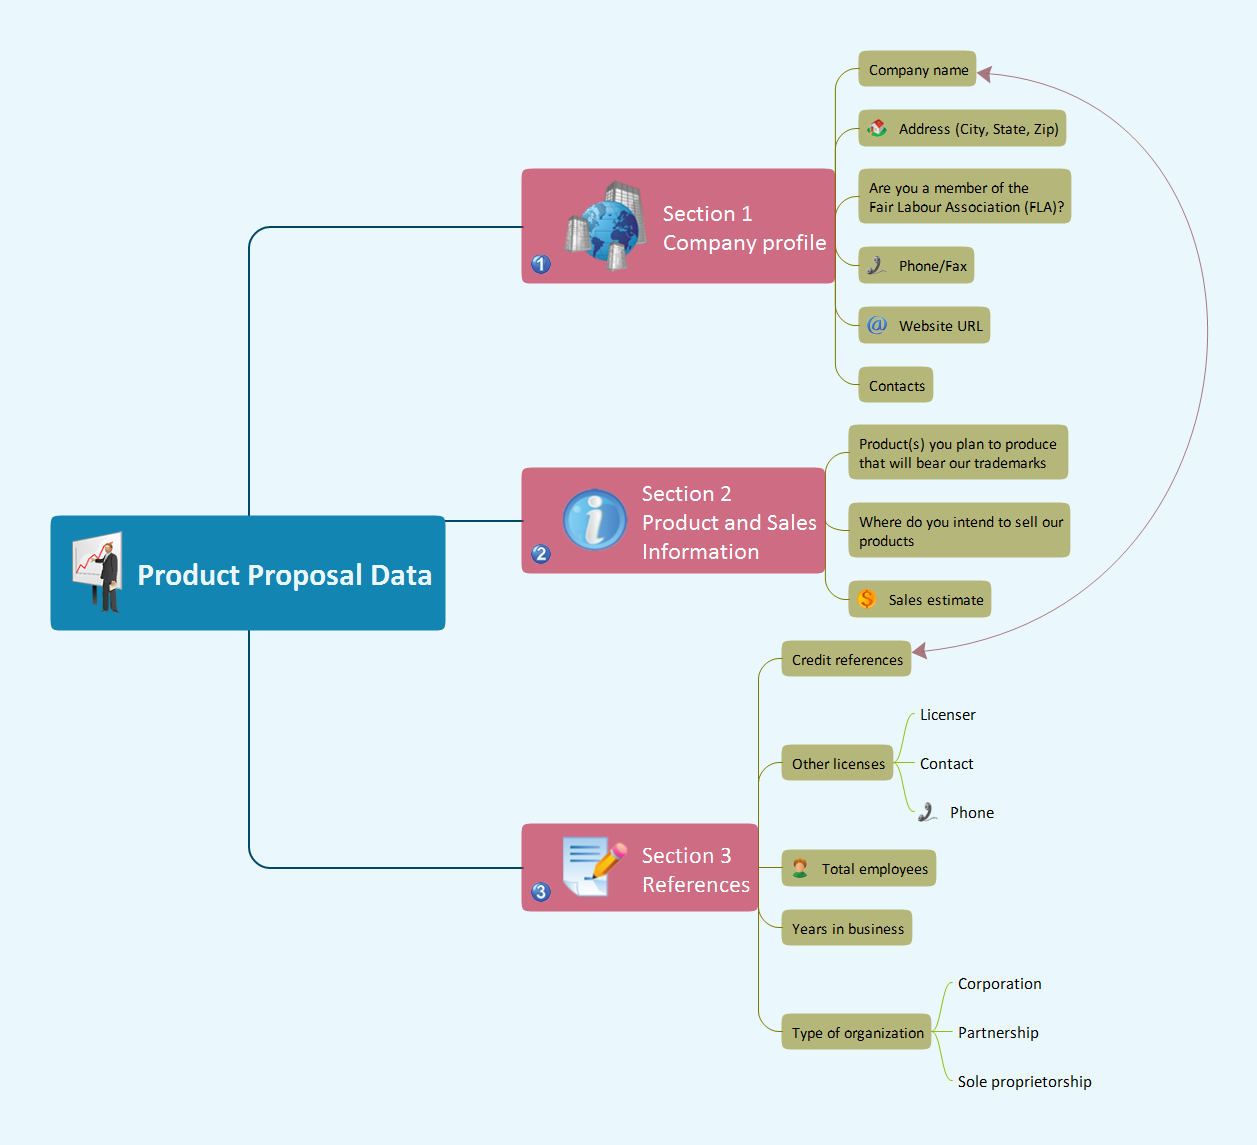
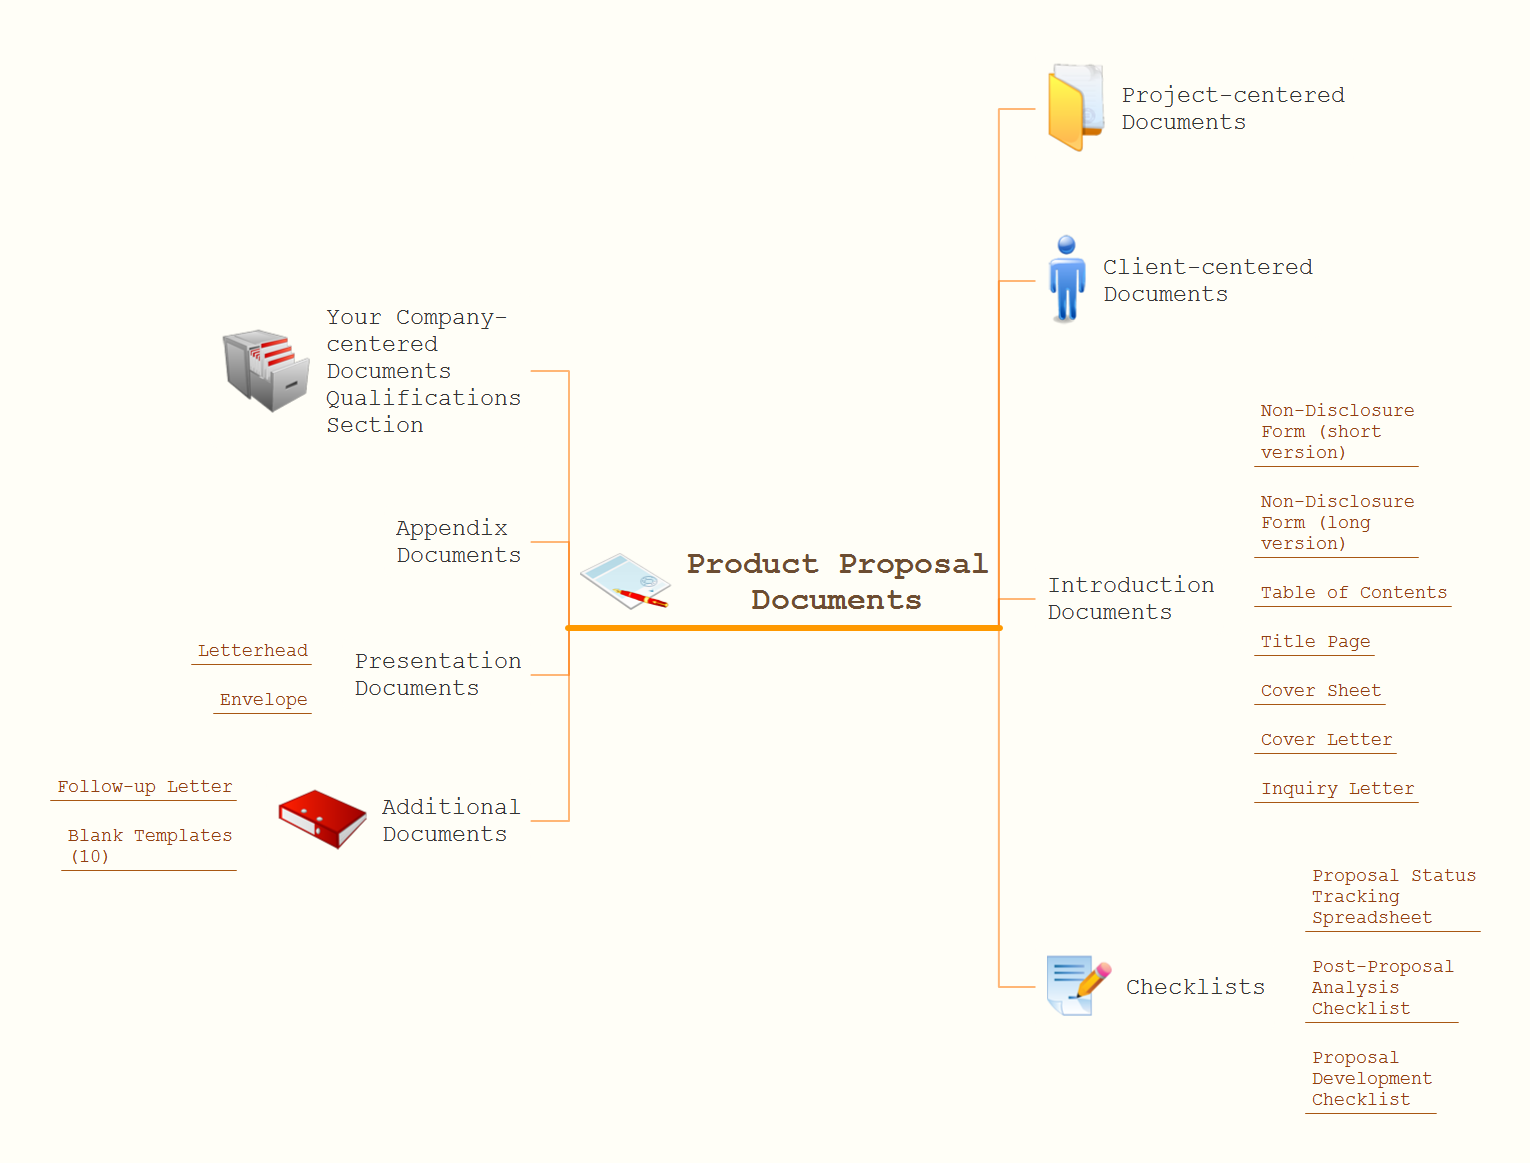
Gather Requirements Exchanging Mind Maps with Evernote
Process Flow Maps

Cross Functional Flowchart for Business Process Mapping

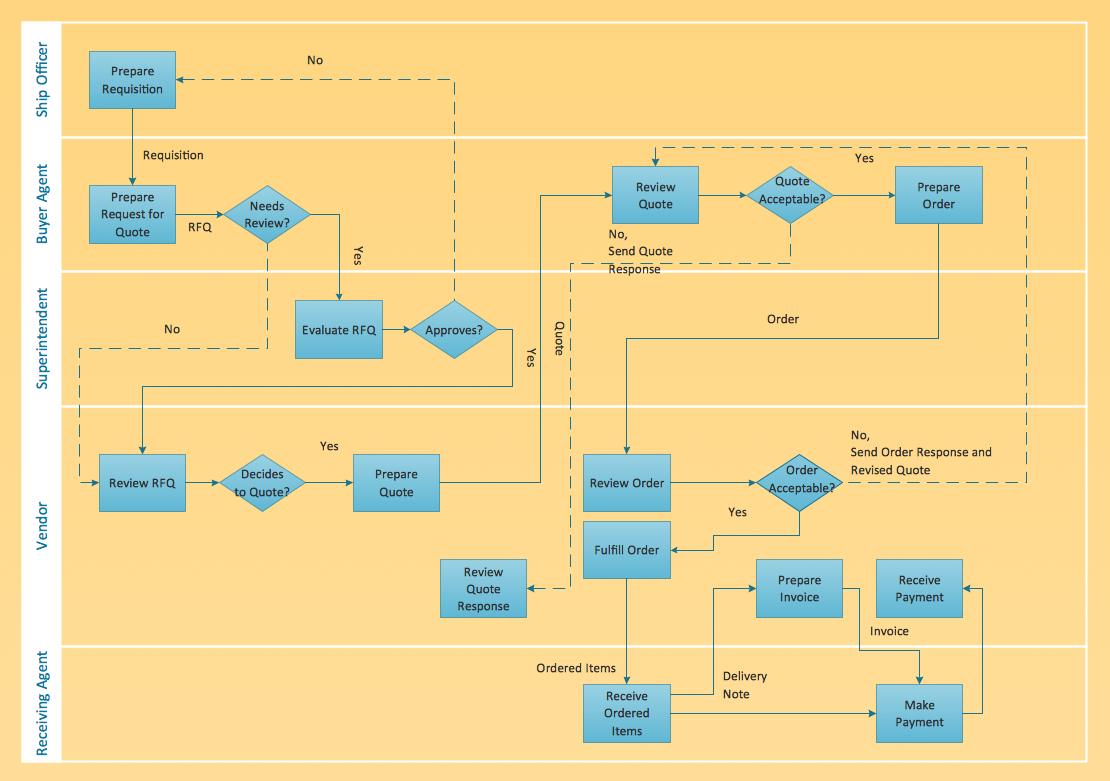
 Cross-Functional Flowcharts
Cross-functional flowcharts are powerful and useful tool for visualizing and analyzing complex business processes which requires involvement of multiple people, teams or even departments. They let clearly represent a sequence of the process steps, the order of operations, relationships between processes and responsible functional units (such as departments or positions).
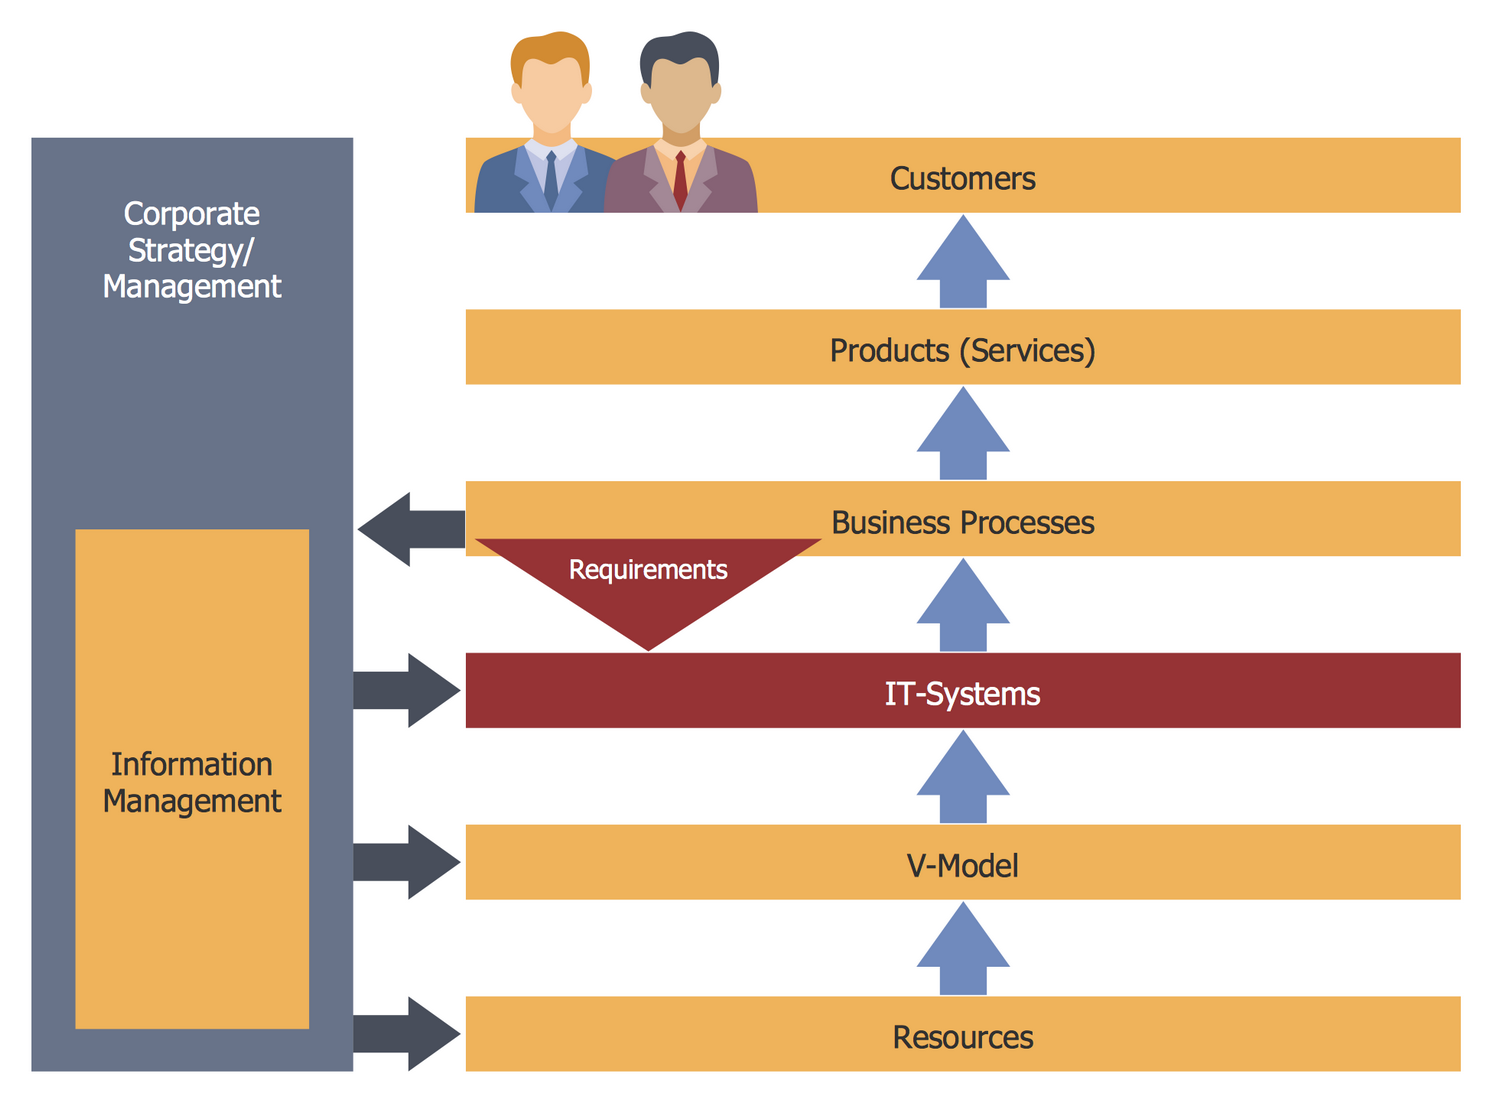
Context Diagram Template

This template shows the Context Diagram. It was created in ConceptDraw DIAGRAM diagramming and vector drawing software using the Block Diagrams Solution from the “Diagrams” area of ConceptDraw Solution Park. The context diagram graphically identifies the system. external factors, and relations between them. It’s a high level view of the system. The context diagrams are widely used in software engineering and systems engineering for designing the systems that process the information.
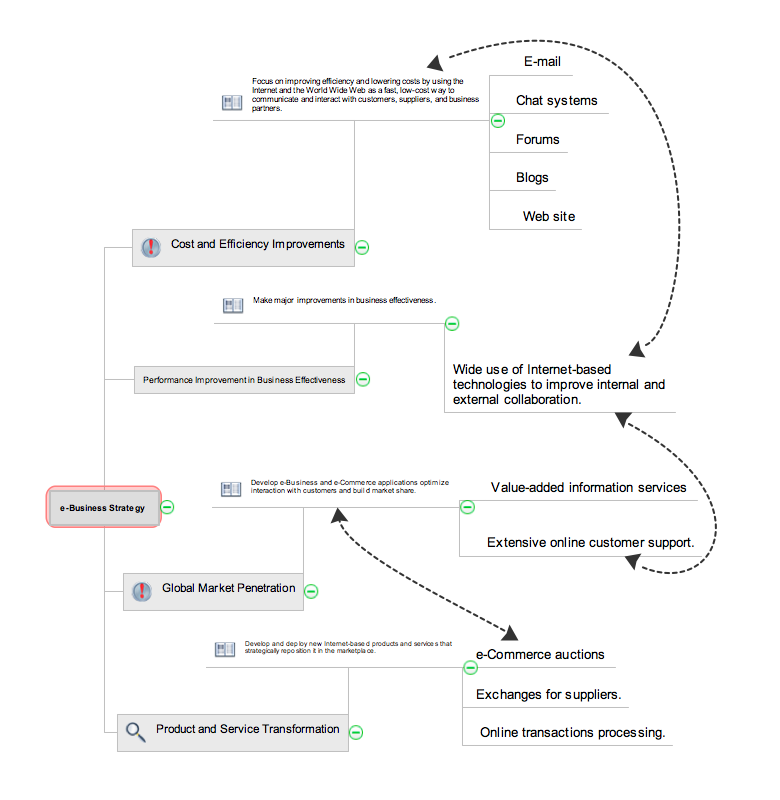
Decision Making Software For Small Business


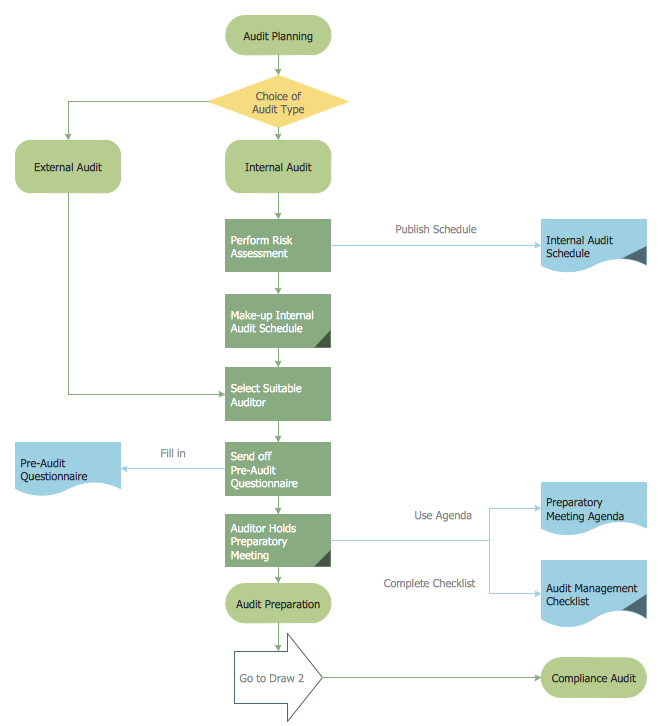
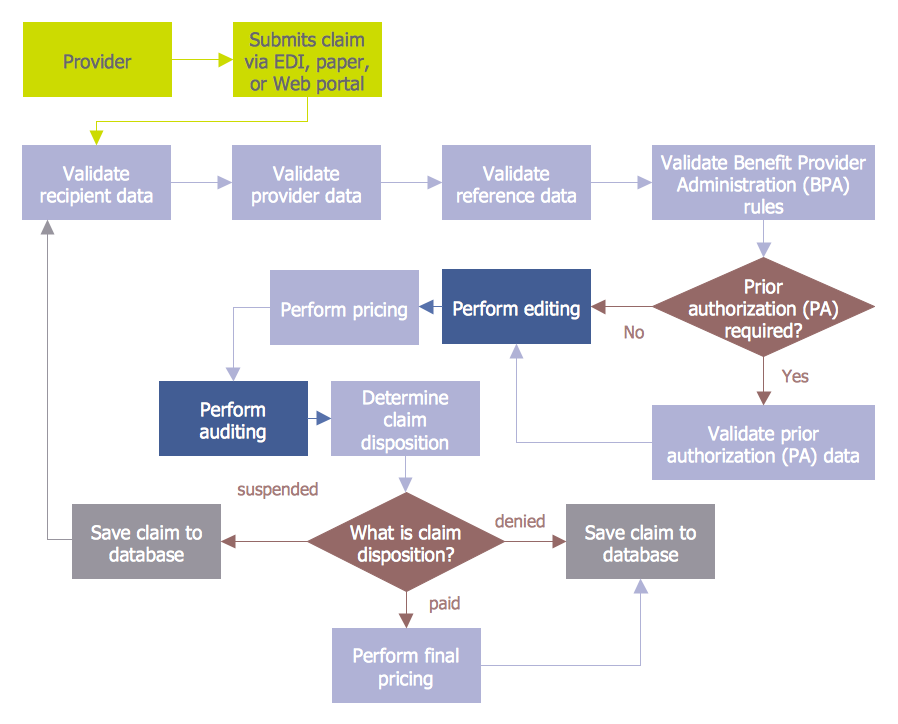
Auditing Process. Audit Planning Process
Business Process Optimization
How to show a mind map presentation via Skype
Flow Chart Symbols

Containment and Cross-Functional Flowcharts
Detail Specifications Exchanging Mind Maps with Evernote
Audit Procedures
Lean Six Sigma Diagram Software

- Cross-Functional Process Map Template | Business Process ...
- IDEF0 diagram template | Process Flowchart | Basic Flowchart ...
- Cross Functional Flowchart Template Excel
- Process Flowchart | Workflow Diagram | Basic Flowchart Symbols ...
- Basic Flowchart Symbols and Meaning | Process Flowchart | Data ...
- Process Flowchart | Data Flow Diagrams | Data Flow Diagram ...
- Cross-Functional Process Map Template | Swim Lane Diagrams ...
- Cross-Functional Flowcharts | Cross-Functional Process Map ...
- Human Resource Process Mapping Template
- Cross-Functional Process Map Template | Process Flowchart ...
- Time Function Map Template Excel
- Process Flowchart | Business Process Mapping — How to Map a ...
- Drawing Business Process Maps
- Process Flowchart | Work Flow Process Chart | Basic Flowchart ...
- Process Flowchart | Basic Flowchart Symbols and Meaning | Flow ...
- Swim Lane Flowchart Symbols | Cross-Functional Flowchart (Swim ...
- Process Flowchart | Business Process Mapping — How to Map a ...
- Basic Flowchart Symbols and Meaning | Process Flowchart | Audit ...
- Cross-Functional Process Map Template | Process Flowchart | Swim ...
- Process Flowchart | Flow Diagram Software | Flowchart Software ...