How should diagramming software work? Is it possible to develop a diagram as quickly as the ideas come to you?
The innovative ConceptDraw Arrows10 Technology included in ConceptDraw DIAGRAM is a powerful drawing flowcharting software that changes the way diagrams are produced.
While making the drawing process easier and faster.
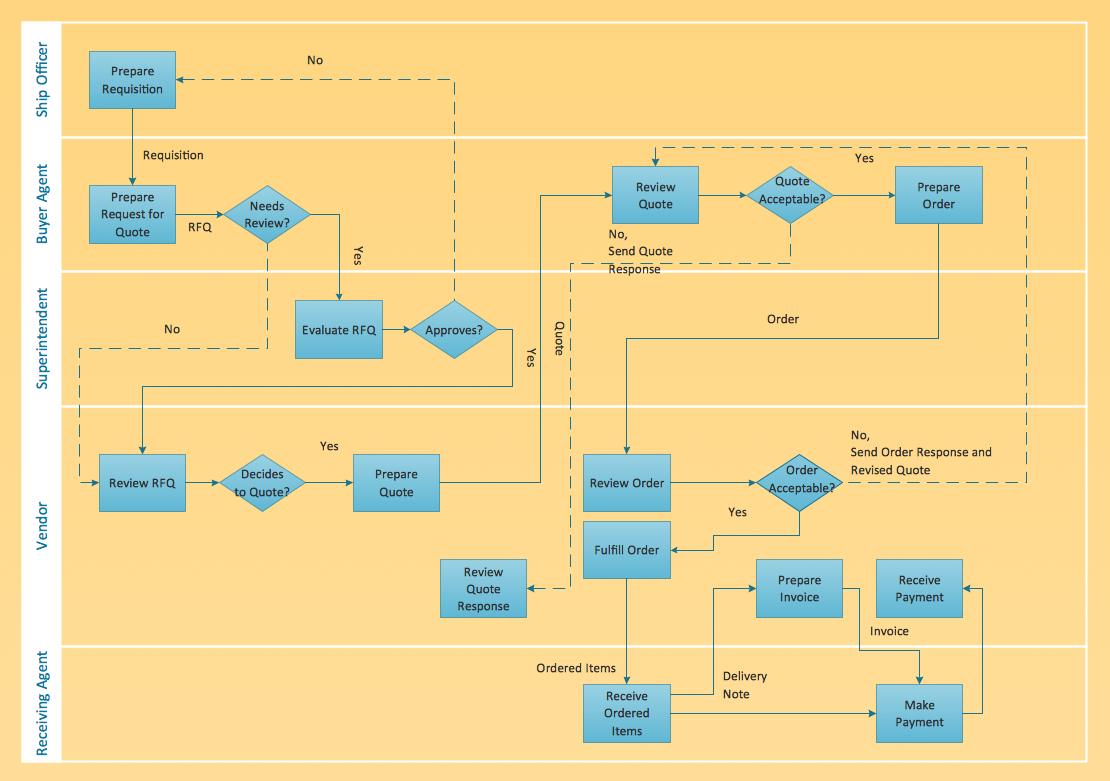
ConceptDraw DIAGRAM is a powerful tool that helps you create professional looking cross-functional flowcharts with the well-designed templates. ConceptDraw DIAGRAM allows you to focus on work, not the drawing process. ConceptDraw Arrows10 Technology allows to draw connectors with smart behavior that gives flexibility to you during work process.
The Involvement Matrix can identify the distribution of responsibilities and identify roles in a group or team. Use the Involvement Matrix to specify roles and responsibilities of actions in problem solving.
ConceptDraw Office suite is a software for corrective actions planning.
The PERT Chart is constructed as part of the process in creating a schedule of corrective actions. The PERT Chart shows the logical connections and consequence of tasks to be performed. It displays the time period for problem solving and the implementation of all activities through the critical path.
ConceptDraw Office suite is a software for corrective actions planning.