Risk Diagram (Process Decision Program Chart)
The Risk Diagram or Process Decision Program Chart (PDPC) is intended to determine the risks of potential obstacles during the corrective actions that can be at the cases of their incorrect performing, and helps to develop effective preventive actions. Process Decision Program Chart it's kind of contingency plan to limit the risks, it determines the consequential impacts of failures on the activity plans. The Risk Plans and Process Decision Program Charts can be extended on several levels and take the form of tree or hierarchy, this form is incredibly convenient for representing the risks and countermeasures. ConceptDraw MINDMAP is powerful software tool for Business, Marketing and Project Management. It is also ideal for easy designing MINDMAP Risk Diagram or Process Decision Program Chart, due to the included "7 Management and Planning Tools" solution to ConceptDraw Solution Park. We recommend to start with Process Decision Program Chart (PDPC) template opening it from ConceptDraw STORE or from the Output tab at ConceptDraw MINDMAP application.Risk Diagram (Process Decision Program Chart)
The risk is a probable event in result of which may occur the negative events and adverse consequences. The risk management is a very important process in any field, it is a process of making the management decisions aimed on the reducing the likelihood of appearing the unfavorable results and on the minimizing potential losses, as well as the implementation of these solutions. The main purpose of applying the risk management is increasing of enterprise's competitiveness with help of protection against the risks. ConceptDraw MINDMAP software is perfect for identifying the risks, analyzing and managing risks, for designing Risk Diagrams, for developing effective actions in response to circumstances and potential obstacles that were identified as risks. It is also the best for designing Process Decision Program Charts and representing the PDPC method, which is effective way of detailed planning and depiction the whole sequence of actions on the path from the formulation a problem to its solution. The PDPC lets determine the risks when corrective actions are not performed correctly and helps develop descriptions for preventive actions.PDPC
ConceptDraw DIAGRAM extended with Seven Management and Planning Tools Solution from the Management Area of ConceptDraw Solution Park is the best software for drawing all types of diagrams from the Seven Management and Planning Tools: Affinity Diagram, Relations Diagram, Prioritization Matrix, Root Cause Analysis Tree Diagram, Involvement Matrix, PERT Chart, and Risk Diagram (PDPC).CORRECTIVE ACTIONS PLANNING. Risk Diagram (PDPC)
Risk Diagram (PDPC) - ConceptDraw Office suite is a software for Risks Diagram making. This diagram identifies possible risks in accomplishing corrective actions. With the Risks Diagram, one analyzes each action separately in a tree of all actions and develops a preventive action in response of each potential obstacles or circumstances which may be a risk.
Risk Analysis
Risk Analysis. ConceptDraw Office suite is a software for decision making. The Seven Management and Planning Tools is a tool for Risks Diagram drawing. This diagram identifies possible risks in accomplishing corrective actions. With the Risks Diagram, one analyzes each action separately in a tree of all actions and develops a preventive action in response of each potential obstacles or circumstances which may be a risk.
Flowchart Program Mac
ConceptDraw software has been developed for drawing any type of flowchart. Use RapidDraw - thi is flowchart maker technology for adding new objects to a flowchart quickly. This is technology of fast drawing technique focused on making great-looking flowcharts quickly. To get started using it download flowchart maker ConceptDraw DIAGRAM.Preventive Action
Preventive Action - ConceptDraw Office suite is a software for the Preventive Action making. The Seven Management and Planning Tools solution is a set of such tools for problems preventive actions via investigating of the core problem. Skilled use of these diagrams makes collaborative teamwork both more engaging and more effective.
Quality Management Teams
ConceptDraw MINDMAP with Quality mindmaps solution as a demonstration of the creative approach to quality management in daily work of quality management team.
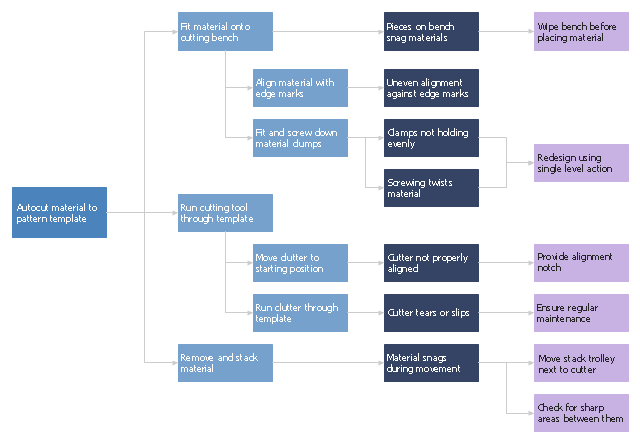
"Process Decision Program Chart (PDPC) is a technique designed to help prepare contingency plans. The emphasis of the PDPC is to identify the consequential impact of failure on activity plans, and create appropriate contingency plans to limit risks. Process diagrams and planning tree diagrams are extended by a couple of levels when the PDPC is applied to the bottom level tasks on those diagrams. ...
From the bottom level of some activity box, the PDPC adds levels for:
(1) identifying what can go wrong (failure mode or risks);
(2) consequences of that failure (effect or consequence);
(3) possible countermeasures (risk mitigation action plan)." [Process decision program chart. Wikipedia]
The process decision program chart (PDPC) example "Personal activity" was created using the ConceptDraw PRO diagramming and vector drawing software extended with the solution "Seven Management and Planning Tools" from the Management area of ConceptDraw Solution Park.
Best Flowcharts
Conceptdraw - feature-rich flowchart software. It will allow you to create professional looking flowcharts.Flowcharts in Word
To create flowcharts in MS Word, programs designed specifically for the purpose of creating flowcharts are particularly well-suited to the task.Basic of Flowchart: Meaning and Symbols
Flowcharts are the best for visually representation the business processes and the flow of a custom-order process through various departments within an organization. ConceptDraw DIAGRAM diagramming and vector drawing software extended with Flowcharts solution offers the full set of predesigned basic flowchart symbols which are gathered at two libraries: Flowchart and Flowcharts Rapid Draw. Among them are: process, terminator, decision, data, document, display, manual loop, and many other specific symbols. The meaning for each symbol offered by ConceptDraw gives the presentation about their proposed use in professional Flowcharts for business and technical processes, software algorithms, well-developed structures of web sites, Workflow diagrams, Process flow diagram and correlation in developing on-line instructional projects or business process system. Use of ready flow chart symbols in diagrams is incredibly useful — you need simply drag desired from the libraries to your document and arrange them in required order. There are a few serious alternatives to Visio for Mac, one of them is ConceptDraw DIAGRAM. It is one of the main contender with the most similar features and capabilities.
Fishbone Diagram Template
A causal model is an abstract concept, that describes the causal mechanisms of a system, by noting certain variables and their influence on each other, in an effort to discover the cause of a certain problem or flaw. This model is presented in diagram form by using a fishbone diagram. ConceptDraw DIAGRAM diagramming and vector drawing software enhanced with Fishbone Diagrams solution helps you create business productivity diagrams from Fishbone diagram templates and examples, that provide to start using of the graphic method for the analysis of problem causes. Each predesigned Fishbone Diagram template is ready to use and useful for instantly drawing your own Fishbone Diagram.Organization Chart
ConceptDraw DIAGRAM diagramming and vector drawing software extended with 25 Typical Orgcharts solution from the Management area of ConceptDraw Solution Park offers 25 ready Organization Chart templates, 10 samples and 2 libraries with predesigned vector objects.Pyramid Diagram
A five level pyramid model of different types of Information Systems based on the information processing requirement of different levels in the organization. five level pyramid example is included in the Pyramid Diagrams solution from Marketing area of ConceptDraw Solution Park."Waste minimization is the process and the policy of reducing the amount of waste produced by a person or a society.
Waste minimization involves efforts to minimize resource and energy use during manufacture. For the same commercial output, usually the fewer materials are used, the less waste is produced. Waste minimization usually requires knowledge of the production process, cradle-to-grave analysis (the tracking of materials from their extraction to their return to earth) and detailed knowledge of the composition of the waste. ...
In the waste hierarchy, the most effective approaches to managing waste are at the top. In contrast to waste minimisation, waste management focuses on processing waste after it is created, concentrating on re-use, recycling, and waste-to-energy conversion." [Waste minimisation. Wikipedia]
The process decision program chart (PDPC) example "Minimization of material wastage" was created using the ConceptDraw PRO diagramming and vector drawing software extended with the solution "Seven Management and Planning Tools" from the Management area of ConceptDraw Solution Park.
Create Process Flowcharts
A process flowchart is a picture of the separate steps of a process in sequential order.Use ConceptDraw DIAGRAM software and the vector stencils from object libraries are designed objects you can use adding to process flowcharts for the best result.Decision Making Software For Small Business
A software tool that saves your time on making decisions now has the ability to make decisions with remote team via Skype.
MS Visio Look a Like Diagrams
No need for any special drawing skills to create professional looking diagrams outside of your knowledge base. ConceptDraw DIAGRAM takes care of the technical details, allowing you to focus on your job, not the drawing. ConceptDraw DIAGRAM delivers full-functioned alternative to MS Visio. ConceptDraw DIAGRAM supports import of Visio files. ConceptDraw DIAGRAM supports flowcharting, swimlane, orgchart, project chart, mind map, decision tree, cause and effect, charts and graphs, and many other diagram types.- Process decision program chart (PDPC) - Personal activity | Risk ...
- Process decision program chart (PDPC) - Personal activity | Process ...
- Travel Infographics | Risk Diagram ( Process Decision Program ...
- Process decision program chart (PDPC) - Personal activity | Seven ...
- Risk Diagram ( Process Decision Program Chart) | Preventive Action
- Risk Diagram ( Process Decision Program Chart) | Basic Flowchart ...
- Process decision program chart (PDPC) - Personal activity | Risk ...
- Decision Making | Organization Chart Software : A Comprehensive ...
- Gantt charts for planning and scheduling projects | Process decision ...
- Material Requisition Flowchart . Flowchart Examples | Process ...
---personal-activity.png--diagram-flowchart-example.png)
