This site uses cookies. By continuing to browse the ConceptDraw site you are agreeing to our Use of Site Cookies.

Process Flowchart

ConceptDraw is Professional business process mapping software for making process flow diagram, workflow diagram, general flowcharts and technical illustrations for business documents. It is includes rich examples, templates, process flowchart symbols. ConceptDraw flowchart maker allows you to easier create a process flowchart. Use a variety of drawing tools, smart connectors, flowchart symbols and shape libraries to create flowcharts of complex processes, process flow diagrams, procedures and information exchange.
How To Create a Process Flow Chart (business process modelling techniques)
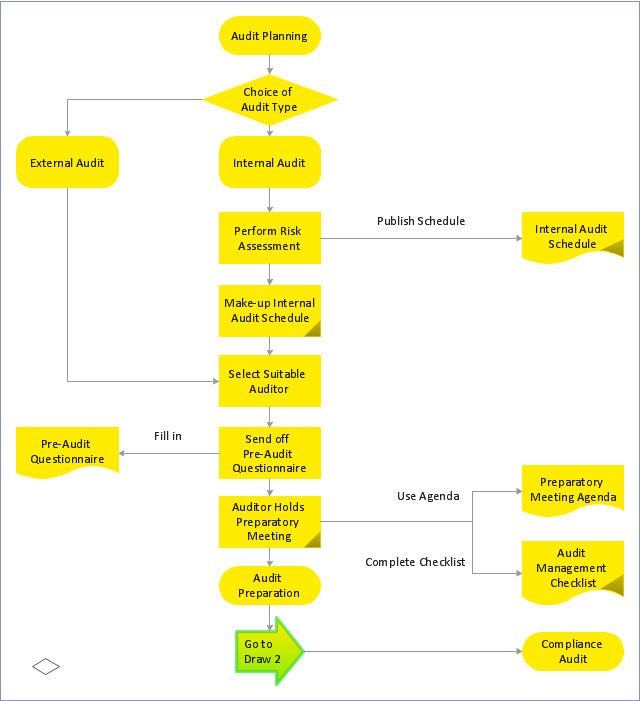
"Audit planning is a vital area of the audit primarily conducted at the beginning of audit process to ensure that appropriate attention is devoted to important areas, potential problems are promptly identified, work is completed expeditiously and work is properly coordinated. "Audit planning" means developing a general strategy and a detailed approach for the expected nature, timing and extent of the audit. The auditor plans to perform the audit in an efficient and timely manner. ...
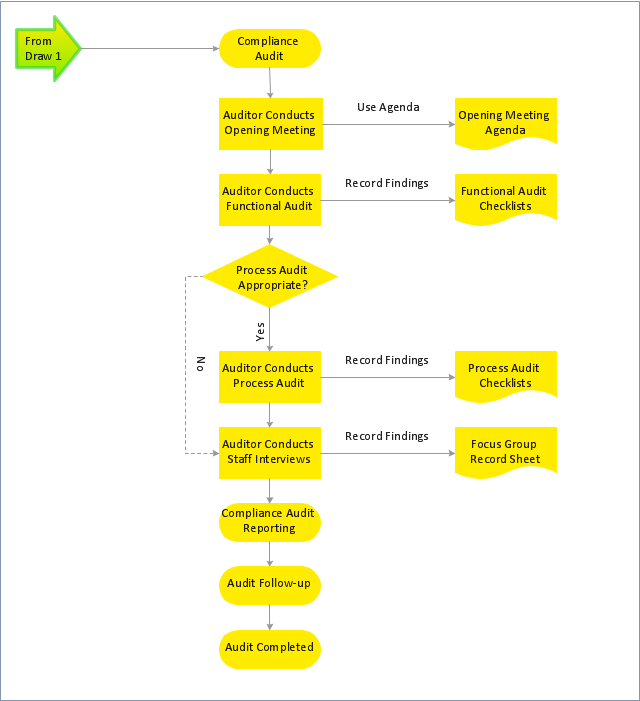
An Audit plan is the specific guideline to be followed when conducting an audit. It helps the auditor obtain sufficient appropriate evidence for the circumstances, helps keep audit costs at a reasonable level, and helps avoid misunderstandings with the client.
It addresses the specifics of what, where, who, when and how:
What are the audit objectives?
Where will the audit be done? (i.e. scope)
When will the audit(s) occur? (how long?)
Who are the auditors?
How will the audit be done?" [Audit plan. Wikipedia]
The audit planning flowchart example was created using the ConceptDraw PRO diagramming and vector drawing software extended with the Audit Flowcharts solution from the Finance and Accounting area of ConceptDraw Solution Park.
www.conceptdraw.com/ solution-park/ finance-audit-flowcharts
Flowchart 1
Flowchart 1, terminator, tagged process, tagged document, off-page reference, event, decision,
Flowchart 2
Flowchart 2, terminator, process, off-page reference, document, decision,

audit flowchart, fiscal flowchart, audit steps, chart audits, chart auditor, auditing process, audit process flowchart, audit planning process Audit Flowcharts

audit flowchart, fiscal flowchart, audit steps, chart audits, chart auditor, auditing process, audit process flowchart, audit planning process
Audit flowcharts solution extends ConceptDraw PRO software with templates, samples and library of vector stencils for drawing the audit and fiscal flow charts.

Audit Process Flowchart. Audit Flowchart

Audit Process Flowchart, Audit Flowchart - Audit Flowcharts solution for ConceptDraw PRO Solution Park provides the Audit Flowcharts library with wide variety of predesigned audit flowchart symbols, and also the set of templates and samples allowing you design your own audit flowchart or audit process flowchart in one moment. Simply use any of offered samples and change it for your needs, or fill the desired template.

TQM Diagram — Professional Total Quality Management

The Total Quality Management Diagram solution helps you and your organization visualize business and industrial processes. Create Total Quality Management diagrams for business process with ConceptDraw software.

Flow chart Example. Warehouse Flowchart

Warehouse Flowcharts are different diagrams describing wharehousing and inventory menagement processes. Typical purposes of warehouse flowcharts are evaluating warehouse performance and organizational performance, measuring efficiency of customer service. This type of workflow diagrams can be used for identifying any disconnection between business activities and business objectives.
Standard warehousing process flow diagram and standard workflow diagram used for process identification for further evaluating effectiveness and profitability of overall business process. Use the ConceptDraw PRO diagramming and vector drawing software extended with the Flowcharts solution from the Diagrams area of ConceptDraw Solution Park to design your own workflow diagrams, process flow diagram and flow charts. Need to use Process Flow Diagram for designing Warehouse packages flow.
ConceptDraw Arrows10 Technology

CORRECTIVE ACTIONS PLANNING. Risk Diagram (PDPC)

Risk Diagram (PDPC) - ConceptDraw Office suite is a software for Risks Diagram making. This diagram identifies possible risks in accomplishing corrective actions. With the Risks Diagram, one analyzes each action separately in a tree of all actions and develops a preventive action in response of each potential obstacles or circumstances which may be a risk.
7MP Tools
7MP Tools

Audit Procedures

Audit procedures are the specific tests and methods that auditor executes when gathering the evidence which are necessary for making an opinion on the financial statements of the firm. There are three types of audit procedures: data selection, reliability validation, relevance confirmation.
Thanks to the extensive drawing tools which provides the Audit Flowcharts solution from the Finance and Accounting area of ConceptDraw Solution Park, you can easy and effectively develop and realize various audit procedures.

How to Create a Social Media DFD Flowchart

Interactive tool helps you create a social media DFD flowchart to find the appropriate response to social media mentions quickly.
It allows companies to be more effective in timely messaging thanks to the ability for rapid response to a customer′s post in social media. This saves budget for companies who use social media for promoting and as a lead generation tool.

Project — Working With Tasks

A full-featured project management solution with all the necessary functions right at your fingertips. Generates an extensive variety of reports on project and task statuses.
These videos provide a series of lessons that will enhance the understanding of all our users, from people just starting out with the software, through to expert users.

Basic Flowchart Symbols and Meaning

Flowchart Symbols and Meaning - Provides a visual representation of basic flowchart symbols and their proposed use in professional workflow diagram, standard process flow diagram and communicating the structure of a well-developed web site, as well as their correlation in developing on-line instructional projects. See flowchart's symbols by specifics of process flow diagram symbols and workflow diagram symbols.
How to Build a Flowchart

Contoh Flowchart

A Flowchart is a graphical representation of the algorithm, process or the step-by-step solution of the problem. There are ten various types of Flowcharts. The ConceptDraw allows you to draw the flowchart of any type.
The Contoh Flowchart included to Flowcharts solution are professional looking practical samples and you can quick and easy modify them, print, or publish on web.
HelpDesk

How to Create an Audit Flowchart Using ConceptDraw PRO

Audit flowcharts are often used in auditors activity. This is the most effective way of preparation and documentation of the audit process. Financial audit process has a clear structure, and therefore audit flowchart is often used to denote an audit process. This is the most effective way of preparation and documentation of the audit process. Flowcharts are often used in auditors activity. A flowchart may be created at any stage of an audit process as an aid in the determination and evaluation of a client's accounting system. ConceptDraw PRO allows you to create professional accounting flowchart quickly using the professional Audit Flowcharts solution.

Business Diagram Software

ConceptDraw business diagram Software is the most powerful business and relational charting software. Create advanced, completely customizable flow charts, organizational charts, business process diagrams, work flow diagrams, audit diagram, value stream maps, TQM diagrams, ERD diagrams, EPC diagrams, marketing diagrams, cause and effect diagrams, dashboards, infographics and other relational business diagrams from your data.
Business Process Modeling

Affinity Diagram

The Affinity Diagram shows the structure of large, complex factors that have an influence on a problem, and then divides them up into a smaller and simpler structure. The Affinity Diagram does not show a causal relationship between the factors. This diagram is designed to prepare the data for further analysis of the cause-effect relationships.