 Audit Flowcharts
Audit flowcharts solution extends ConceptDraw DIAGRAM software with templates, samples and library of vector stencils for drawing the audit and fiscal flow charts.
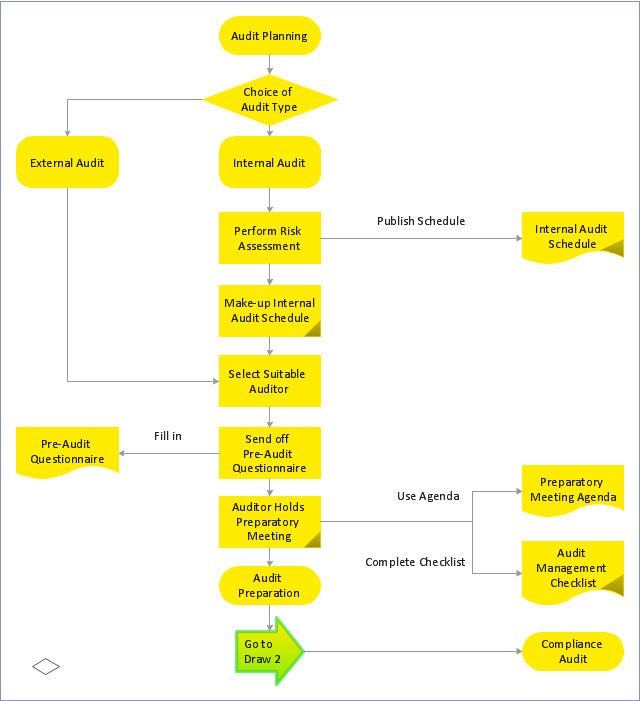
"Audit planning is a vital area of the audit primarily conducted at the beginning of audit process to ensure that appropriate attention is devoted to important areas, potential problems are promptly identified, work is completed expeditiously and work is properly coordinated. "Audit planning" means developing a general strategy and a detailed approach for the expected nature, timing and extent of the audit. The auditor plans to perform the audit in an efficient and timely manner. ...
An Audit plan is the specific guideline to be followed when conducting an audit. It helps the auditor obtain sufficient appropriate evidence for the circumstances, helps keep audit costs at a reasonable level, and helps avoid misunderstandings with the client.
It addresses the specifics of what, where, who, when and how:
What are the audit objectives?
Where will the audit be done? (i.e. scope)
When will the audit(s) occur? (how long?)
Who are the auditors?
How will the audit be done?" [Audit plan. Wikipedia]
The audit planning flowchart example was created using the ConceptDraw PRO diagramming and vector drawing software extended with the Audit Flowcharts solution from the Finance and Accounting area of ConceptDraw Solution Park.
www.conceptdraw.com/ solution-park/ finance-audit-flowcharts
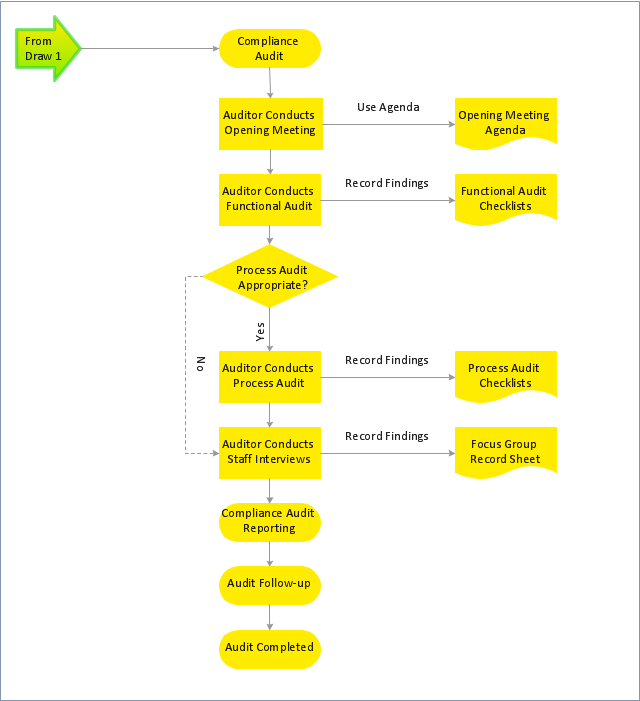
Flowchart 1
Flowchart 2
Sales Process Flowchart Symbols

Material Requisition Flowchart. Flowchart Examples

This value stream map example was redesigned from the Wikipedia file: ValueStreamMapParts.png.
[en.wikipedia.org/ wiki/ File:ValueStreamMapParts.png]
This file is licensed under the Creative Commons Attribution-Share Alike 3.0 Unported license. [creativecommons.org/ licenses/ by-sa/ 3.0/ deed.en]
"Value stream mapping (VSM) refers to the activity of developing a visual representation of the flow of processes, from start to finish, involved in delivering a desired outcome, service, or product (a “value stream”) that is valued by customers. In the context of government, a value stream could be the process of conducting an audit, completing a procurement, or hiring new agency staff. VSM can increase understanding of actual decision-making processes and identify sources of non-value-added time (e.g., documents waiting to be reviewed). The typical products of a 2-5 day VSM workshop are a map of the “current state” of targeted processes and a “future state” map of the desired process flow and an associated implementation plan for future process improvement activities." [en.wikibooks.org/ wiki/ Business_ Analysis_ Guidebook/ LEAN]
The VSM diagram example "Value stream map parts" was created using the ConceptDraw PRO diagramming and vector drawing software extended with the Value Stream Mapping solution from the Quality area of ConceptDraw Solution Park.
Value stream mapping

Think and act effectively

Business Process Modeling with ConceptDraw
How to Create a Pyramid Diagram

 Value Stream Mapping
Value stream mapping solution extends ConceptDraw DIAGRAM software with templates, samples and vector stencils for drawing the Value Stream Maps (VSM) in lean manufacturing practice.
 Business Productivity Area
Business Productivity Solutions extend ConceptDraw products with tools for making presentations, conducting meetings, preparing documents, brainstorming, or building new strategies.
 Stakeholder Onion Diagrams
The Stakeholder Onion Diagram is often used as a way to view the relationships of stakeholders to a project goal. A basic Onion Diagram contains a rich information. It shows significance of stakeholders that will have has influence to the success achieve
 SWOT and TOWS Matrix Diagrams
SWOT and TOWS Matrix Diagrams solution extends ConceptDraw DIAGRAM and ConceptDraw MINDMAP software with features, templates, samples and libraries of vector stencils for drawing SWOT and TOWS analysis matrices and mind maps.
- Audit Flowcharts | Basic Audit Flowchart . Flowchart Examples | Audit ...
- Audit Process Flowchart
- Audit Process Flowchart . Audit Flowchart
- Auditing Process . Audit Planning Process | Audit Steps | Audit ...
- Process Flowchart | Internal Audit Process | Audit planning flowchart ...
- Audit Flowcharts | Design elements - Audit flowchart | Audit Process ...
- Basic Audit Flowchart . Flowchart Examples | Audit Flowcharts | Audit ...
- Process Flowchart | Audit planning flowchart | Internal Audit Process ...
- Project planning process - Flowchart | Audit planning flowchart ...
- Audit Flowcharts | Audit Process Flowchart . Audit Flowchart | Basic ...
- Basic Flowchart Symbols and Meaning | Process Flowchart | Audit ...
- Internal Audit Process | Design elements - Audit flowchart | Audit ...
- Audit flowchart - Overview of resolution process following an Audit ...
- Project planning process - Flowchart | Process Flowchart | Audit ...
- Importance Of Using Flow Charts While Conducting An Audit
- Process Flowchart | Internal Audit Process | Auditing Process . Audit ...
- Project planning process - Flowchart | Auditing Process . Audit ...
- Process Flowchart | Basic Flowchart Symbols and Meaning | Audit ...
- Process Flowchart | Audit Flowcharts | Audit Flowchart Symbols ...
- Audit Flowcharts | How to Create an Audit Flowchart Using ...