Sample Pictorial Chart. Sample Infographics
")
HelpDesk
How to Draw a Pictorial Chart in ConceptDraw PRO

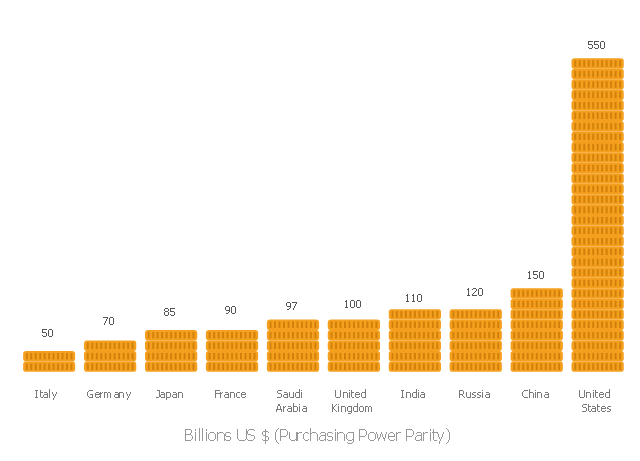
This pictorial bar chart sample shows visual comarison of top ten countries by military expenditure for 2007 by purchasing power parity (PPP) at constant (2005) prices and exchange rates.
It was designed on the base of the Wikimedia Commons file: 2007 top 10 countries by military expenditure PPP.svg.
[commons.wikimedia.org/ wiki/ File:2007_ top_ 10_ countries_ by_ military_ expenditure_ PPP.svg]
"A military budget (or military expenditure), also known as a defense budget, is the amount of financial resources dedicated by an entity (most often a nation or a state), to raising and maintaining an armed forces. Military budgets often reflect how strongly an entity perceives the likelihood of threats against it, or the amount of aggression it wishes to employ. It also gives an idea of how much financing should be provided for the upcoming year. The size of a budget also reflects the entity's ability to fund military activities. Factors include the size of that entity's economy, other financial demands on that entity, and the willingness of that entity's government or people to fund such military activity. Generally excluded from military expenditures is spending on internal law enforcement and disabled veteran rehabilitation." [Military budget. Wikipedia]
The picture bar chart example "2007 top 10 countries by military expenditure PPP" was created using the ConceptDraw PRO diagramming and vector drawing software extended with the Picture Graphs solution from the Graphs and Charts area of ConceptDraw Solution Park.
Picture bar graph
Pictorial Chart

This pictorial bar chart sample shows visual comarison of top ten countries by military expenditure for 2007 by purchasing power parity (PPP) at constant (2005) prices and exchange rates.
It was designed on the base of the Wikimedia Commons file: 2007 top 10 countries by military expenditure PPP.svg.
[commons.wikimedia.org/ wiki/ File:2007_ top_ 10_ countries_ by_ military_ expenditure_ PPP.svg]
"A military budget (or military expenditure), also known as a defense budget, is the amount of financial resources dedicated by an entity (most often a nation or a state), to raising and maintaining an armed forces. Military budgets often reflect how strongly an entity perceives the likelihood of threats against it, or the amount of aggression it wishes to employ. It also gives an idea of how much financing should be provided for the upcoming year. The size of a budget also reflects the entity's ability to fund military activities. Factors include the size of that entity's economy, other financial demands on that entity, and the willingness of that entity's government or people to fund such military activity. Generally excluded from military expenditures is spending on internal law enforcement and disabled veteran rehabilitation." [Military budget. Wikipedia]
The picture bar chart example "2007 top 10 countries by military expenditure PPP" was created using the ConceptDraw PRO diagramming and vector drawing software extended with the Picture Graphs solution from the Graphs and Charts area of ConceptDraw Solution Park.
It was designed on the base of the Wikimedia Commons file: 2007 top 10 countries by military expenditure PPP.svg.
[commons.wikimedia.org/ wiki/ File:2007_ top_ 10_ countries_ by_ military_ expenditure_ PPP.svg]
"A military budget (or military expenditure), also known as a defense budget, is the amount of financial resources dedicated by an entity (most often a nation or a state), to raising and maintaining an armed forces. Military budgets often reflect how strongly an entity perceives the likelihood of threats against it, or the amount of aggression it wishes to employ. It also gives an idea of how much financing should be provided for the upcoming year. The size of a budget also reflects the entity's ability to fund military activities. Factors include the size of that entity's economy, other financial demands on that entity, and the willingness of that entity's government or people to fund such military activity. Generally excluded from military expenditures is spending on internal law enforcement and disabled veteran rehabilitation." [Military budget. Wikipedia]
The picture bar chart example "2007 top 10 countries by military expenditure PPP" was created using the ConceptDraw PRO diagramming and vector drawing software extended with the Picture Graphs solution from the Graphs and Charts area of ConceptDraw Solution Park.
Picture bar graph
Process Flowchart


How to Draw Pictorial Chart. How to Use Infograms

Basic Flowchart Symbols and Meaning


Infographic Maker

Information Graphics

Make an Infographic

 ConceptDraw Solution Park
ConceptDraw Solution Park collects graphic extensions, examples and learning materials
How to create a UML Diagram

Design Pictorial Infographics. Design Infographics

- How to Draw a Pictorial Chart in ConceptDraw PRO | How to Draw ...
- 10 Class Pictorial Chart In English
- How to Draw a Pictorial Chart in ConceptDraw PRO | Design ...
- Design Pictorial Infographics. Design Infographics | Sample Pictorial ...
- How to Draw a Pictorial Chart in ConceptDraw PRO | Sample ...
- Sample Pictorial Chart . Sample Infographics | Design Pictorial ...
- Sample Pictorial Chart . Sample Infographics | How to Draw Pictorial ...
- How to Draw a Pictorial Chart in ConceptDraw PRO | Process ...
- Sample Pictorial Chart . Sample Infographics | How to Draw a ...
- Pictorial Chart Templates
- How to Draw Pictorial Chart . How to Use Infograms | Sample ...
- How to Draw a Pictorial Chart in ConceptDraw PRO | How to Draw ...
- UML in 10 mins | ConceptDraw PRO Compatibility with MS Visio ...
- Process Flowchart | How to Draw a Line Graph | Sample Pictorial ...
- Design Pictorial Infographics. Design Infographics | How to Draw ...
- 10 Flowchat Symbols And Their Meaning
- Design Pictorial Infographics. Design Infographics | How to Draw ...
- How to Draw Pictorial Chart . How to Use Infograms | How to Draw a ...
- Sample Pictorial Chart . Sample Infographics | Pie Graph Worksheets ...
- How to Draw Pictorial Chart . How to Use Infograms | Design Pictorial ...