Road Transport - Design Elements

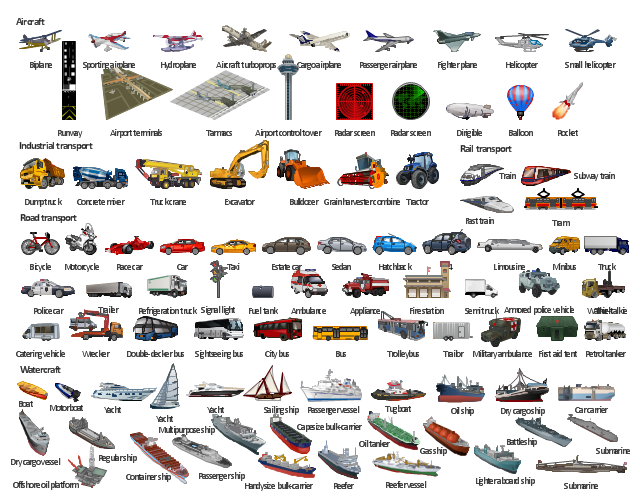
The illustration template "Transport" contains vector clipart of transportation vehicles, office buildings and ancillary facilities.
"Transport or transportation is the movement of people, animals and goods from one location to another. Modes of transport include air, rail, road, water, cable, pipeline and space. The field can be divided into infrastructure, vehicles and operations. Transport is important because it enables trade between people, which is essential for the development of civilizations. Transport infrastructure consists of the fixed installations including roads, railways, airways, waterways, canals and pipelines and terminals such as airports, railway stations, bus stations, warehouses, trucking terminals, refueling depots (including fueling docks and fuel stations) and seaports. Terminals may be used both for interchange of passengers and cargo and for maintenance. Vehicles traveling on these networks may include automobiles, bicycles, buses, trains, trucks, people, helicopters and aircraft." [Transport. Wikipedia]
The illustration template "Transport" for the ConceptDraw PRO diagramming and vector drawing software is included in the Aerospace and Transport solution from the Illustration area of ConceptDraw Solution Park.
Vector clip art - Illustration template
How to draw Metro Map style infographics? (New York)
</i> *")
Basic Flowchart Symbols and Meaning


UML Class Diagram Example for Transport System

 Jackson Structured Programming (JSP) Diagrams
The Jackson Structured Programming (JSP) Diagram solution extends the functionality and drawing abilities of the ConceptDraw DIAGRAM software with set of illustrative JSP diagrams samples and large variety of predesigned vector objects of actions, processes, procedures, selection, iteration, as well as arrows and connectors to join the objects during Jackson structured development and designing Jackson structured programming diagrams, JSP diagram, Jackson structure diagram (JSD), Program structure diagram. The powerful abilities of this solution make the ConceptDraw DIAGRAM ideal assistant for programmers, software developers, structural programmers, computer engineers, applications constructors, designers, specialists in structured programming and Jackson systems design, and other technical, computer and software specialists.
Rail transport - Design elements

 Family Tree
Family Tree solution with included vector design shapes for drawing family trees, pedigree chart symbols, photo blocks of different detailing and professionally designed samples, extends the functionality of ConceptDraw DIAGRAM software making it the best family tree maker and easy-to-use ancestry trees designer program for researchers, scientists, historians, genetics, medics, archeologists, and other stakeholders. Use it to design informative and colorful genealogy trees, simple family tree or extensive ancestry tree of any depth, genealogy schematics and illustrations with family trees.
Flowchart Definition

 Active Directory Diagrams
Active Directory Diagrams solution significantly extends the capabilities of ConceptDraw DIAGRAM software with special Active Directory samples, convenient template and libraries of Active Directory vector stencils, common icons of sites and services, icons of LDPA elements, which were developed to help you in planning and modelling network structures and network topologies, in designing excellently looking Active Directory diagrams, Active Directory Structure diagrams, and Active Directory Services diagram, which are perfect way to visualize detailed structures of Microsoft Windows networks, Active Directory Domain topology, Active Directory Site topology, Organizational Units (OU), and Exchange Server organization.
 Continent Maps
Continent Maps solution extends ConceptDraw DIAGRAM software with templates, samples and libraries of vector stencils for drawing the thematic maps of continents, state maps of USA and Australia.
 Business Process Diagrams
Business Process Flow Diagrams solution extends the ConceptDraw DIAGRAM BPM software with RapidDraw interface, templates, business process diagrams examples and numerous libraries based on the BPMN 1.2 and BPMN 2.0 standards, which give you the possibility to visualize equally easy simple and complex processes, to design business models, to quickly develop and document in details any business processes on the stages of project’s planning and implementation.
Building Drawing. Design Element: Piping Plan


 Presentation Exchange
This solution extends ConceptDraw MINDMAP software with the ability to import presentations from Microsoft PowerPoint, as well as enhancing its existing presentation capabilities.
 Histograms
How to make a Histogram? Making a Histogram is an incredibly easy process when it is done with ConceptDraw DIAGRAM. The Histograms Solution enhances ConceptDraw DIAGRAM functionality with extensive drawing tools, numerous samples, and examples; also a quick-start template and library of ready vector stencils for visualization the data and professional drawing Histograms.
Data Flow Diagram

, t chart, decision matrix, decision tree analysis") Decision Making
Decision Making
The Decision Making solution offers the set of professionally developed examples, powerful drawing tools and a wide range of libraries with specific ready-made vector decision icons, decision pictograms, decision flowchart elements, decision tree icons, decision signs arrows, and callouts, allowing the decision maker (even without drawing and design skills) to easily construct Decision diagrams, Business decision maps, Decision flowcharts, Decision trees, Decision matrix, T Chart, Influence diagrams, which are powerful in questions of decision making, holding decision tree analysis and Analytic Hierarchy Process (AHP), visual decomposition the decision problem into hierarchy of easily comprehensible sub-problems and solving them without any efforts.
 Quality Mind Map
This solution extends ConceptDraw MINDMAP software with Quality Management Mind Maps (Presentations, Meeting Agendas, Problem to be solved).
 SYSML
SYSML
The SysML solution helps to present diagrams using Systems Modeling Language; a perfect tool for system engineering.
 Business Process Mapping
The Business Process Mapping solution for ConceptDraw DIAGRAM is for users involved in process mapping and creating SIPOC diagrams.
- Mechanical Drawing Symbols | Transport - Template | Swim Lane ...
- Names Of Water Transport Vehicles
- Rail transport - Design elements | Beauty in nature Illustrations and ...
- Road transport - Vector stencils library | Design elements - Road ...
- Example Of Water Transportation
- Transport Hazard Pictograms | Rail transport - Design elements ...
- Aircraft examples | Aerospace and Transport | HVAC Plans ...
- Different Modes Of Transport
- Design elements - Watercraft | House plumbing plan | Transport ...
- Design elements - Aircraft | Aerospace and Transport | Transport ...
- Fishbone Diagram | Workflow diagram - Weather forecast | HVAC ...
- Class Diagram For Air Transportation System
- Design elements - Watercraft | Transport - Template | Watercraft ...
- Road Transport - Design Elements | Industrial transport - Design ...
- How to draw Metro Map style infographics? (Los Angeles) | Rail ...
- Rail transport - Vector stencils library | Design elements - Rail ...
- Basic Flowchart Symbols and Meaning | Flow Chart Symbols ...
- Road Transport - Design Elements | Aerospace and Transport ...
- Watercraft - Design Elements | Rail transport - Design elements ...
- Industrial transport - Design elements | Rail transport - Vector ...