 Fishbone Diagram
Fishbone Diagrams solution extends ConceptDraw PRO software with templates, samples and library of vector stencils for drawing the Ishikawa diagrams for cause and effect analysis.
This work flow chart sample was redesigned from the picture "Weather Forecast" from the article "Simulation Workflows".
[iaas.uni-stuttgart.de/ forschung/ projects/ simtech/ sim-workflows.php]
"(1) The weather is predicted for a particular geological area. Hence, the workflow is fed with a model of the geophysical environment of ground, air and water for a requested area.
(2) Over a specified period of time (e.g. 6 hours) several different variables are measured and observed. Ground stations, ships, airplanes, weather balloons, satellites and buoys measure the air pressure, air/ water temperature, wind velocity, air humidity, vertical temperature profiles, cloud velocity, rain fall, and more.
(3) This data needs to be collected from the different sources and stored for later access.
(4) The collected data is analyzed and transformed into a common format (e.g. Fahrenheit to Celsius scale). The normalized values are used to create the current state of the atmosphere.
(5) Then, a numerical weather forecast is made based on mathematical-physical models (e.g. GFS - Global Forecast System, UKMO - United Kingdom MOdel, GME - global model of Deutscher Wetterdienst). The environmental area needs to be discretized beforehand using grid cells. The physical parameters measured in Step 2 are exposed in 3D space as timely function. This leads to a system of partial differential equations reflecting the physical relations that is solved numerically.
(6) The results of the numerical models are complemented with a statistical interpretation (e.g. with MOS - Model-Output-Statistics). That means the forecast result of the numerical models is compared to statistical weather data. Known forecast failures are corrected.
(7) The numerical post-processing is done with DMO (Direct Model Output): the numerical results are interpolated for specific geological locations.
(8) Additionally, a statistical post-processing step removes failures of measuring devices (e.g. using KALMAN filters).
(9) The statistical interpretation and the numerical results are then observed and interpreted by meteorologists based on their subjective experiences.
(10) Finally, the weather forecast is visualized and presented to interested people." [iaas.uni-stuttgart.de/ forschung/ projects/ simtech/ sim-workflows.php]
The example "Workflow diagram - Weather forecast" was drawn using the ConceptDraw PRO diagramming and vector drawing software extended with the Workflow Diagrams solution from the Business Processes area of ConceptDraw Solution Park.
Work flow chart

 HVAC Plans
Use HVAC Plans solution to create professional, clear and vivid HVAC-systems design plans, which represent effectively your HVAC marketing plan ideas, develop plans for modern ventilation units, central air heaters, to display the refrigeration systems for automated buildings control, environmental control, and energy systems.
 Metro Map
Metro Map solution extends ConceptDraw PRO software with templates, samples and library of vector stencils for drawing the metro maps, route maps, bus and other transport schemes, or design tube-style infographics.
 Correlation Dashboard
Correlation dashboard solution extends ConceptDraw PRO software with samples, templates and vector stencils library with Scatter Plot Charts for drawing the visual dashboard visualizing data correlation.
 Pie Charts
Pie Charts are extensively used in statistics and business for explaining data and work results, in mass media for comparison (i.e. to visualize the percentage for the parts of one total), and in many other fields. The Pie Charts solution for ConceptDraw PRO v10 offers powerful drawing tools, varied templates, samples, and a library of vector stencils for simple construction and design of Pie Charts, Donut Chart, and Pie Graph Worksheets.
 Illustration Area
Solutions from the Illustrations Area of ConceptDraw Solution Park collect templates, samples and libraries of color scalable vector stencils, icons and clip art for illustrating documents, presentations, infographics, web sites and blogs.
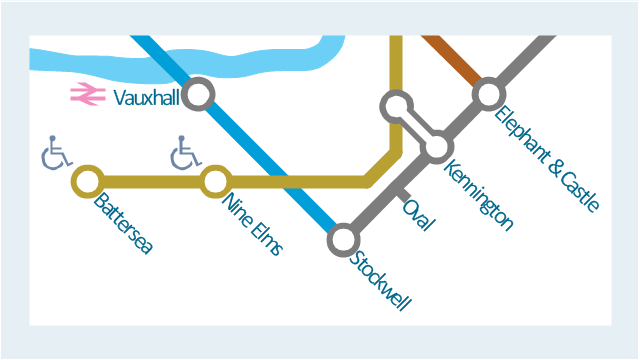
This spatial infographic example was created on the base of the tube map from the Transport for London website.
[tfl.gov.uk/ assets/ images/ general/ 24746-nle-gallery-tube-map.jpg]
"The Tube map is a schematic transit map of the lines and stations of London's public rapid transit railway systems, namely the London Underground (commonly known as the Tube, hence the name), Docklands Light Railway, London Overground and Emirates Air Line, as well as being incorporated into Greater London connections maps.
As a schematic diagram, it shows not necessarily the geographic but rather the relative positions of stations along the lines, stations' connective relations with each other and fare zones. The basic design concepts have been widely adopted for other network maps around the world, especially that of mapping topologically rather than geographically." [Tube map. Wikipedia]
The spatial infographics example "Metro map - Northern line extension to Battersea via Nine Elms" was created using the ConceptDraw PRO diagramming and vector drawing software extended with the Spatial Infographics solution from the area "What is Infographics" of ConceptDraw Solution Park.
Tube map
- Fishbone Diagram | Five Examples Of Airtransport
- Example Of Air Transport
- Air Transport Diagram
- Workflow diagram - Weather forecast | Diagrams Of Means Of Air ...
- Fishbone Diagram | Design elements - Aircraft | Transport ...
- Air Transportation Examples
- Exsmples Of Air Transport
- Air Transportation Diagram
- Piping and Instrumentation Diagram Software | Examples Of Air ...
- Piping and Instrumentation Diagram Software | Types Of Air ...
- Examples Of Air Transport Pictures Easy To Draw
- What Is Air Transportation With Diagram
- Diagram Of A Rail Transport And Air Transport
- Examples Of Transportation By Air
- How To Make Project On Air Transport In Chart
- Draw The Two Example Of Air Transportation
- Diagrams Of Air Means Of Transportation
- Fishbone Diagram | Fishbone Diagrams | Aerospace and Transport ...
- Road Transport - Design Elements | UML Class Diagram Example ...
- Diagram Of Means Of Transportation