 Aerospace and Transport
This solution extends ConceptDraw PRO software with templates, samples and library of vector clipart for drawing the Aerospace and Transport Illustrations. It contains clipart of aerospace objects and transportation vehicles, office buildings and anci
This work flow chart sample was redesigned from the picture "Weather Forecast" from the article "Simulation Workflows".
[iaas.uni-stuttgart.de/ forschung/ projects/ simtech/ sim-workflows.php]
"(1) The weather is predicted for a particular geological area. Hence, the workflow is fed with a model of the geophysical environment of ground, air and water for a requested area.
(2) Over a specified period of time (e.g. 6 hours) several different variables are measured and observed. Ground stations, ships, airplanes, weather balloons, satellites and buoys measure the air pressure, air/ water temperature, wind velocity, air humidity, vertical temperature profiles, cloud velocity, rain fall, and more.
(3) This data needs to be collected from the different sources and stored for later access.
(4) The collected data is analyzed and transformed into a common format (e.g. Fahrenheit to Celsius scale). The normalized values are used to create the current state of the atmosphere.
(5) Then, a numerical weather forecast is made based on mathematical-physical models (e.g. GFS - Global Forecast System, UKMO - United Kingdom MOdel, GME - global model of Deutscher Wetterdienst). The environmental area needs to be discretized beforehand using grid cells. The physical parameters measured in Step 2 are exposed in 3D space as timely function. This leads to a system of partial differential equations reflecting the physical relations that is solved numerically.
(6) The results of the numerical models are complemented with a statistical interpretation (e.g. with MOS - Model-Output-Statistics). That means the forecast result of the numerical models is compared to statistical weather data. Known forecast failures are corrected.
(7) The numerical post-processing is done with DMO (Direct Model Output): the numerical results are interpolated for specific geological locations.
(8) Additionally, a statistical post-processing step removes failures of measuring devices (e.g. using KALMAN filters).
(9) The statistical interpretation and the numerical results are then observed and interpreted by meteorologists based on their subjective experiences.
(10) Finally, the weather forecast is visualized and presented to interested people." [iaas.uni-stuttgart.de/ forschung/ projects/ simtech/ sim-workflows.php]
The example "Workflow diagram - Weather forecast" was drawn using the ConceptDraw PRO diagramming and vector drawing software extended with the Workflow Diagrams solution from the Business Processes area of ConceptDraw Solution Park.
Work flow chart

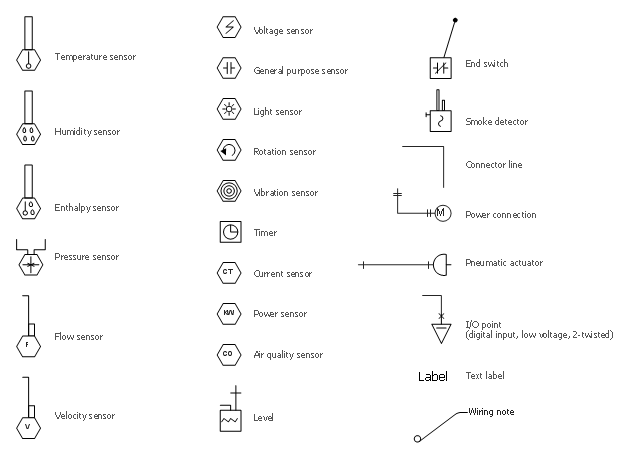
The vector stencils library "HVAC controls" contains 23 symbols of HVAC controls (sensors, actuators, timers, controllers, I/ O points).
"HVAC (... Heating, Ventilation and Air Conditioning) is a control system that applies regulation to a heating and/ or air conditioning system. ...
Central controllers and most terminal unit controllers are programmable, meaning the direct digital control program code may be customized for the intended use. The program features include time schedules, setpoints, controllers, logic, timers, trend logs, and alarms. The unit controllers typically have analog and digital inputs that allow measurement of the variable (temperature, humidity, or pressure) and analog and digital outputs for control of the transport medium (hot/ cold water and/ or steam). Digital inputs are typically (dry) contacts from a control device, and analog inputs are typically a voltage or current measurement from a variable (temperature, humidity, velocity, or pressure) sensing device. Digital outputs are typically relay contacts used to start and stop equipment, and analog outputs are typically voltage or current signals to control the movement of the medium (air/ water/ steam) control devices such as valves, dampers, and motors." [HVAC control system. Wikipedia]
Use the design elements library "HVAC controls" for drawing the HVAC system diagrams, controls drawings, and automated building control and environmental control system layuout floor plans using the ConceptDraw PRO diagramming and vector drawing software.
The shapes library "HVAC controls" is included in the HVAC Plans solution from the Building Plans area of ConceptDraw Solution Park.
HVAC control symbols
 IDEF Business Process Diagrams
Use the IDEF Business Process Diagrams solution to create effective database designs and object-oriented designs, following the integration definition methodology.
Network Visualization with ConceptDraw PRO

- Diagrams Of Means Of Air Transport
- Draw Class Diagram For Air Transportation System
- Air Transport Diagram
- Air Transportation System Class Diagram
- Show The Diagram Of Jet As The Mean Of Air Transport
- Fishbone Diagram | Aerospace and Transport | Basic Pie Charts ...
- Aerospace and Transport | HVAC Plans | Fishbone Diagram ...
- Diagram Of Air Transport
- Exsmples Of Air Transport
- Means Of Transportation Diagram
- Air Transport Digrem
- Diagrams Of Means Of Transportation
- Fishbone Diagram | HVAC Plans | Transport pictograms - Vector ...
- Example Of Air Transport
- Rail transport - Design elements | Watercraft - Design Elements ...
- Fishbone Diagram | Design elements - Aircraft | Examples Of ...
- Air Transport
- Examples Of Air Transport Pictures Easy To Draw
- Make A Diagram Of Air Transportation