HelpDesk
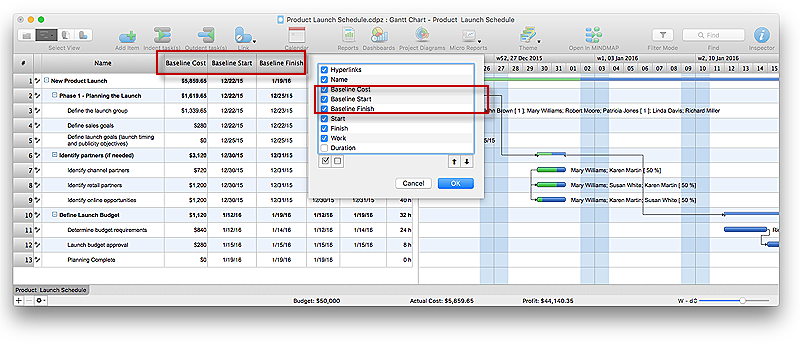
How to Set a Project Baseline Using ConceptDraw PROJECT
Project baseline in ConceptDraw PROJECT is excellent forguiding the execution of the current project and can be useful for further projects.HelpDesk
How to Track Your Project Plan vs. the Actual Project Condition
Conceptdraw PROJECT provides user with the possibility to track how the project is going. Project Manager can compare the actual data with the planned and assess possible measures to resolve issues. Conceptdraw PROJECT has several types of visual reports that can help to assess visually the difference between planned and actual project data.HelpDesk
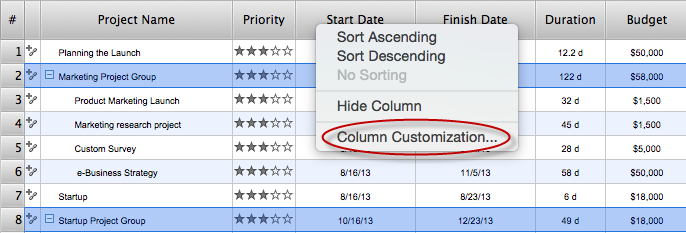
What Information to be Displayed in the ConceptDraw PROJECT Gantt Chart View
What information can can contain the project task list? Gantt Chart view is a graphical representation of a project outline that allows one to allocate tasks.You can customize a project’s tasks list view to include the columns you need to meet your information requirements. The columns of the ConceptDraw PROJECT Gantt view contain the information you want to capture about each task in your project. The following article details what information can be contained in the columns of a project outline:<
HelpDesk
What Information can be Displayed in the Multiproject Dashboard View
What information can can contain the projects list
HelpDesk
How to Create a Mind Map from Selected Tasks in Project
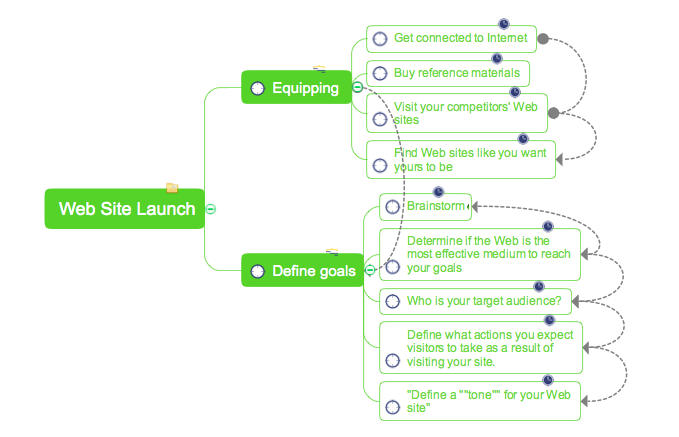
You can see the project data in a mind map structure by create a mind map from the selected project tasks.
HelpDesk
How to Import Project Data From MS Excel File
You can import information into the project from MS Excel workbook using the entered fields - fields in which you can enter or edit information as opposed to calculated fields.HelpDesk
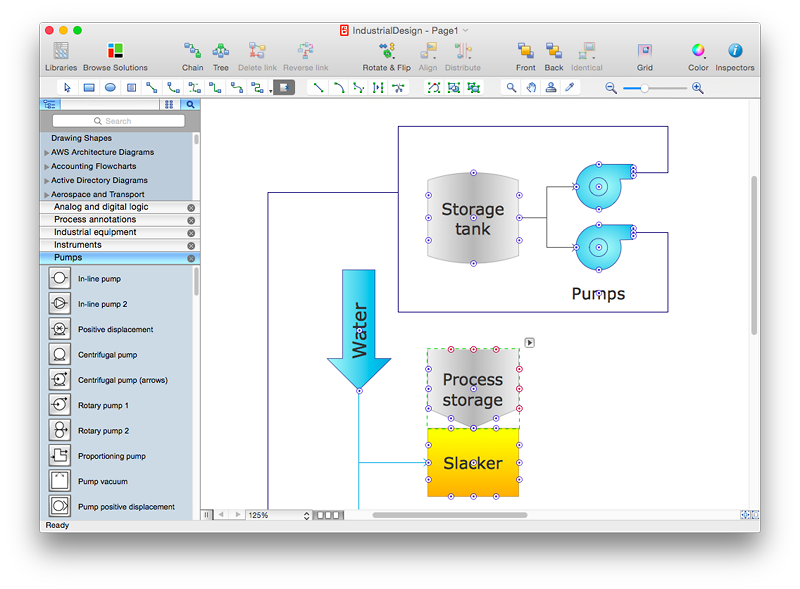
How to Add, Move, or Delete Connection Points in ConceptDraw PRO on Mac
Some tips on how to manage connection points in ConceptDraw PRO drawings on Macintosh. A connection point is a special point on an object that allows one to connect a connector. You can add connection points to any object or to the blank area in your document.ConceptDraw PROJECT Project Management Software Tool
ConceptDraw PROJECT is simple project management software. If you are on the fast track in your career and start facing such challenges as coordination many people, coordination tasks and works, manage project with a great deal of time and money involved - it is the right time to get Project management tool involved in your work.How to Create Gantt Chart
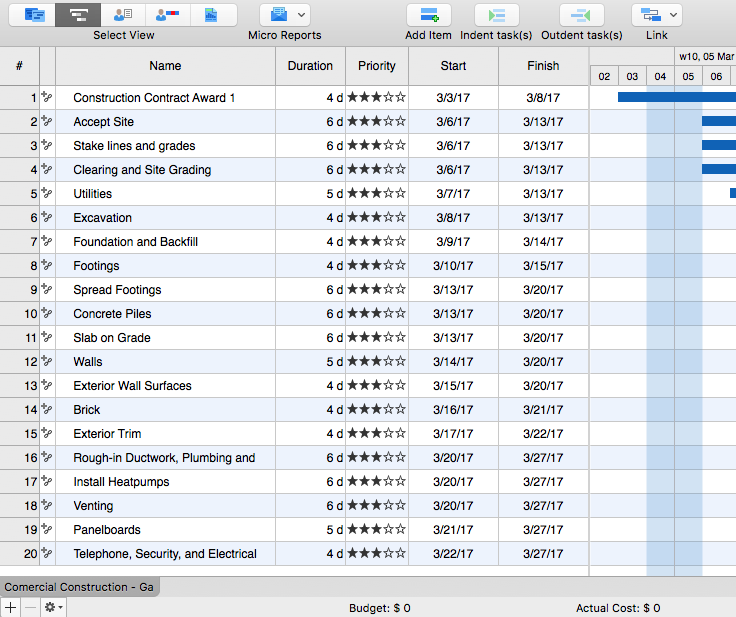
To begin managing a new project, you will need to define the individual Tasks that must be completed to deliver it. The default view for a new project in ConceptDraw PROJECT is the Gantt Chart.HelpDesk
How to Create a Custom Filter in ConceptDraw PROJECT for Windows
With ConceptDraw Project, you can filter project data so that you only see the information that’s most important to you.How to Discover Critical Path on a Gantt Chart
ConceptDraw PROJECT is the Gantt chart software that implements critical path method to provide the user with a wide set of project management tools.Gant Chart in Project Management
Gantt Chart is a graphical representation of tasks as segments on a time scale. It helps plan and monitor project development or resource allocation. There are list of tasks, project milesones and stages. The horizontal axis is a time scale, expressed either in absolute or relative time. Gantt chart can be used for planning in virtually any industry. There are major project planning tools using gantt chart for creating project plan. For instance, using ConceptDraw PROJECT together with ConceptDraw MINDMAP for planning marketing actions is very effective way. It makes ConceptDraw Office best marketing project management software for gantt chart planning marketing message, scheduling stages when to send massive text messages or when use email marketing services in specific projects. There are simple steps on how to use project management software for marketing, sales actions and product support. This is simple all in one toolbox for managers who need best project management software for small business as for planning and brainstorming as for reporting at project execution stage. Using gantt charts together with mindmap visuals and professional presentations charts make it excellent creative project management software. ConceptDraw PROJECT is portfolio project management software it allows manage many projects with multi gantt chart.
How to Create Presentation of Your Project Gantt Chart
During the planning, discussing and execution of a project you may need to prepare a presentation using project views such as the Gantt Chart, Multiproject Dashboard or Resource Usage View. It’s easy do with ConceptDraw PROJECT!Gantt Chart Software
The Gantt Chart is the main interface in ConceptDraw PROJECT. It summarizes the tasks in your project and presents them graphically so you can easily view your progress.- How to Set a Project Baseline Using ConceptDraw PROJECT | Venn ...
- How to Set a Project Baseline Using ConceptDraw PROJECT ...
- How to Set a Project Baseline Using ConceptDraw PROJECT | How ...
- How to Set a Project Baseline Using ConceptDraw PROJECT ...
- How to Set a Project Baseline Using ConceptDraw PROJECT | How ...
- What Information to be Displayed in the ConceptDraw PROJECT ...
- How to Track Your Project Plan vs. the Actual Project Condition ...
- Project planning process - Flowchart | Top 5 Android Flow Chart ...
- How to Track Your Project Plan vs. the Actual Project Condition | PM ...
- How to Track Your Project Plan vs. the Actual Project Condition ...
- How to Publish Project Reports on the Web Using ConceptDraw PRO
- How to Draw a Gantt Chart Using ConceptDraw PRO | How to ...
- How to Export Project Data to MS Excel Worksheet | How to ...
- How to Use ConceptDraw PROJECT Micro - Reports | How to ...
- How to Draw a Gantt Chart Using ConceptDraw PRO | What ...
- How to Use the Effort-Driven Scheduling Method | Project planning ...
- How to Remove ConceptDraw Products from Mac and PC | How to ...
- Task Types in ConceptDraw Project | How to Track Your Project ...
- What Information to be Displayed in the ConceptDraw PROJECT ...
