HelpDesk
How to Track Your Project Plan vs. the Actual Project Condition
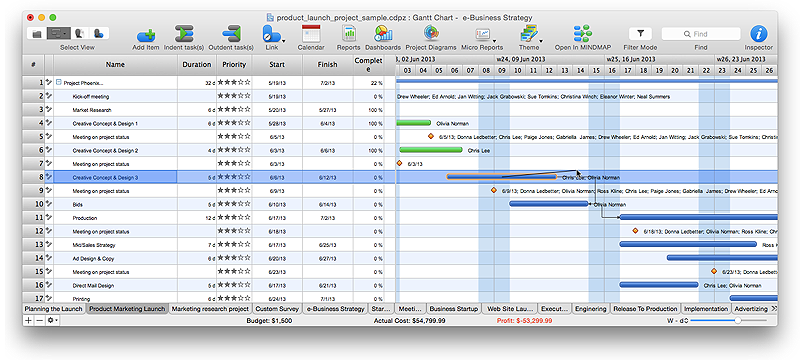
Conceptdraw PROJECT allows to follow how the project is going. You can easily compare the actual project data with the planned ones. The best tool for effective tracking of the project execution is to compoare real data with project baseline. It consists from the baseline start, baseline finish and baseline cost. Along with Baseline tracking ConceptDraw PROJECT offers several types of visual reports that can help to assess visually the difference between planned and actual project data.
 PM Dashboards
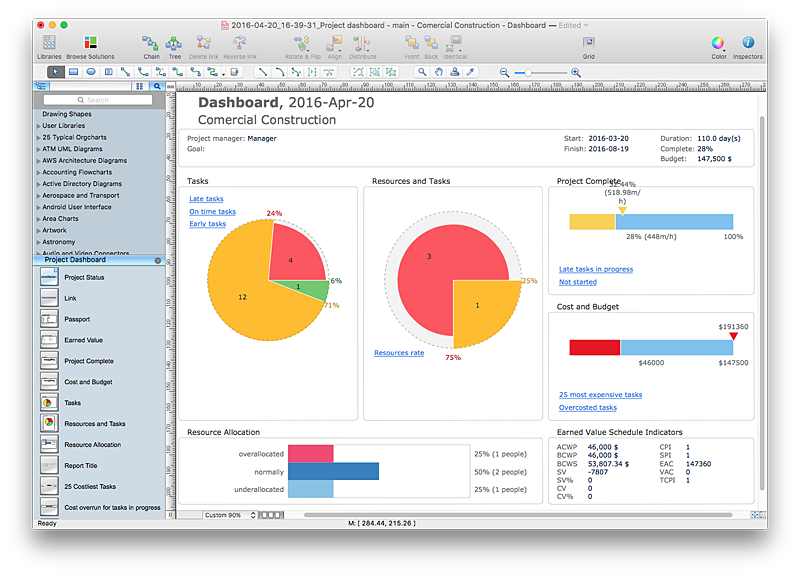
This solution extends ConceptDraw PRO and ConceptDraw PROJECT software with the ability to clearly display the identified key performance indicators for any project.
HelpDesk
How to Shift Dates in ConceptDraw PROJECT
A way to shift all dates in a project a specified period, so you can use old project schedules as a template for new schedules
 Timeline Diagrams
Timeline Diagrams solution extends ConceptDraw PRO software with templates, samples and library of vector stencils for drawing the timeline and milestones diagrams.
 Project Exchange
This solution extends ConceptDraw PROJECT and ConceptDraw MINDMAP software with the ability to import and export project data.
How To Create Project Report
ConceptDraw PROJECT contains an extensive tool set to help project managers. The rich data visualization capability that is provided by ConceptDraw products helps you create project dashboards, one-click reports, multi-project views, Gantt charts, and resource views. Let′s learn how to get maximum value using ConceptDraw PROJECT!
 ConceptDraw Solution Park
ConceptDraw Solution Park collects graphic extensions, examples and learning materials
 PM Presentations
This solution extends ConceptDraw MINDMAP and ConceptDraw PRO software, improving the efficiency of the project management process by using the same source data to build targeted presentations.
How to Report Task's Execution with Gantt Chart
ConceptDraw PROJECT’s powerful reporting engine lets you generate a set of tabular reports with just one click, or visualize your project as Radial Tasks Structures, Work Breakdown Structures and Resource Calendars. It also provides you with dynamic Project Dashboards.Construction Project Chart Examples
ConceptDraw PROJECT provides a set of construction Gantt chart examples. Project manager requires task tracking, and project examples best approach to start. Make your project applying one of our ready-made examples.
 PM Planning
This solution extends ConceptDraw MINDMAP and ConceptDraw Project software, allowing you to automatically create documents that reflect a project's status, for people who have different project roles.
 Status Dashboard
Status dashboard solution extends ConceptDraw PRO software with templates, samples and vector stencils libraries with graphic indicators for drawing the visual dashboards showing status data.
HelpDesk
How to Create Project Diagrams on PC
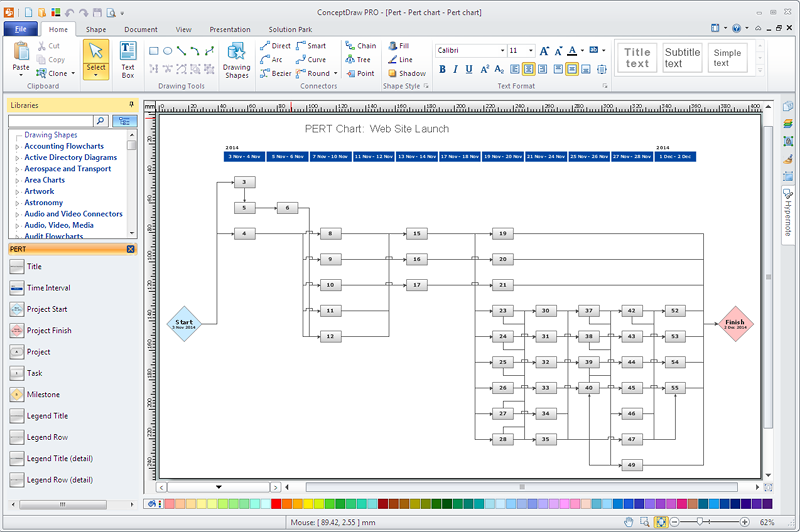
Visual diagrams gives the ability to view at a detailed level project attributes such as project scope, logical connections in the project, critical paths, key events on the timeline, milestones, tasks, calendars for work, and resource utilization.- Gant Chart in Project Management | Project Timeline | How to ...
- PM Dashboards | KPI Dashboard | How to Create Project ...
- Project Dashboard Excel
- PM Dashboards | KPI Dashboard | How to Plan and Allocate ...
- Business diagrams & Org Charts with ConceptDraw PRO | Timeline ...
- PM Dashboards | How to Track Your Project Plan vs. the Actual ...
- PM Planning | PM Dashboards | Project —Task Trees and ...
- Communication Plan Project Management For Parks
- How to Create Multple Projects Schedule on Windows | How to ...
- PM Dashboards | How to Plan and Allocate Resources in Your ...
- How To Create Project Report | How to Create Project Diagrams on ...
- Project timeline diagram - New business project plan | Project ...
- PM Dashboards | PM Response | Projects HR dashboard ...
- Remote Projects in Corporate Strategy | PM Dashboards ...
- PM Dashboards | Project Exchange | Project — Assigning ...
- Communication Tool for Remote Project Management | Examples of ...
- Project management life cycle - Flowchart | Basic Diagramming | PM ...
- Management Diagrams For Construction Project
- PM Dashboards | Construction Project Chart Examples | Flowcharts ...
- PM Dashboards | How to Manage Multiple Projects on Windows ...


