HelpDesk
How to Create Multiple Projects Schedule on macOS

Project Timeline

HelpDesk
How to Operate with Project Time Frames in ConceptDraw PROJECT

HelpDesk
How to Shift Dates in ConceptDraw PROJECT

"Project planning is part of project management, which relates to the use of schedules such as Gantt charts to plan and subsequently report progress within the project environment.
Initially, the project scope is defined and the appropriate methods for completing the project are determined. Following this step, the durations for the various tasks necessary to complete the work are listed and grouped into a work breakdown structure. Project planning is often used to organize different areas of a project, including project plans, work loads and the management of teams and individuals. The logical dependencies between tasks are defined using an activity network diagram that enables identification of the critical path. Float or slack time in the schedule can be calculated using project management software. Then the necessary resources can be estimated and costs for each activity can be allocated to each resource, giving the total project cost. At this stage, the project schedule may be optimized to achieve the appropriate balance between resource usage and project duration to comply with the project objectives. Once established and agreed, the project schedule becomes what is known as the baseline schedule. Progress will be measured against the baseline schedule throughout the life of the project. Analyzing progress compared to the baseline schedule is known as earned value management.
The inputs of the project planning phase include the project charter and the concept proposal. The outputs of the project planning phase include the project requirements, the project schedule, and the project management plan." [Project planning. Wikipedia]
The flow chart example "Project planning process" was created using the ConceptDraw PRO diagramming and vector drawing software extended with the Flowcharts solution from the area "What is a Diagram" of ConceptDraw Solution Park.
Flowchart - Project planning process

HelpDesk
How to Use the Effort-Driven Scheduling Method

HelpDesk
How to Create a Gantt Chart for Your Project

HelpDesk
How to Customize Columns in Your Project Schedule

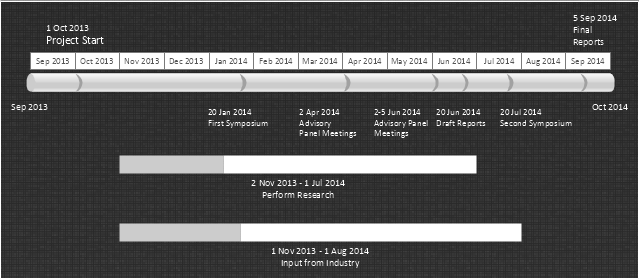
"In project management, a schedule is a listing of a project's milestones, activities, and deliverables, usually with intended start and finish dates. Those items are often estimated in terms of resource allocation, budget and duration, linked by dependencies and scheduled events. A schedule is commonly used in project planning and project portfolio management parts of project management. Elements on a schedule may be closely related to the Work Breakdown Structure (WBS) terminal elements, the Statement of work, or a Contract Data Requirements List." [Schedule (project management). Wikipedia]
The timeline diagram example "Project schedule" was created using the ConceptDraw PRO diagramming and vector drawing software extended with the Timeline Diagrams solution from the Management area of ConceptDraw Solution Park.
The timeline diagram example "Project schedule" was created using the ConceptDraw PRO diagramming and vector drawing software extended with the Timeline Diagrams solution from the Management area of ConceptDraw Solution Park.
Project schedule
Gantt charts for planning and scheduling projects

HelpDesk
How to Improve a Project by Using a Mind Map

HelpDesk
How to Use Critical Path Analysis for Scheduling Complex Projects

Timeline Diagrams

HelpDesk
How to Connect a Single Project Items

HelpDesk
How to View Tasks of Multiple Projects Using Scheduler

 Timeline Diagrams
Timeline Diagrams solution extends ConceptDraw DIAGRAM diagramming software with samples, templates and libraries of specially developed smart vector design elements of timeline bars, time intervals, milestones, events, today marker, legend, and many other elements with custom properties, helpful for professional drawing clear and intuitive Timeline Diagrams. Use it to design simple Timeline Diagrams and designate only the main project stages, or highly detailed Timeline Diagrams depicting all project tasks, subtasks, milestones, deadlines, responsible persons and other description information, ideal for applying in presentations, reports, education materials, and other documentation.
Timeline Examples

Creating a Schedule

CORRECTIVE ACTIONS PLANNING. PERT Chart


- Project — Working With Costs | How to Create Multiple Projects ...
- It Project Management Process Flow Chart
- How to Create Multple Projects Schedule on Windows | Gantt charts ...
- How to Use the Effort-Driven Scheduling Method | Project planning ...
- Project plan timeline - Request for proposal (RFP) | Activity Network ...
- Gantt charts for planning and scheduling projects | Gant Chart in ...
- How to Change the Working Time in a Project | Calendar Templates ...
- ConceptDraw News | New in ConceptDraw PROJECT v7 Help Desk
- Block diagram - Planning process | Project planning process ...
- Gantt charts for planning and scheduling projects | Project ...
- Project Timeline | Timeline Examples | How to Make a Timeline ...
- Timeline diagram - Project schedule | Project plan timeline ...
- Project planning process - Flowchart | ConceptDraw PROJECT ...
- How to Create a Timeline Diagram in ConceptDraw PRO | Project ...
- Timeline Examples | Project Timeline | Timeline Diagrams | Visio ...
- Project — Working With Costs | Gantt charts for planning and ...
- Sample Project Flowchart. Flowchart Examples | Project ...
- CORRECTIVE ACTIONS PLANNING . PERT Chart | Daily Schedule ...
- CORRECTIVE ACTIONS PLANNING . PERT Chart | Project planning ...