How to Create a Powerful Infographic When You do not Have a Designer

 What are Infographic Area
Solutions of the area What is Infographics from ConceptDraw Solution Park collect templates, samples and vector stencils libraries with design elements for the drawing information graphics.
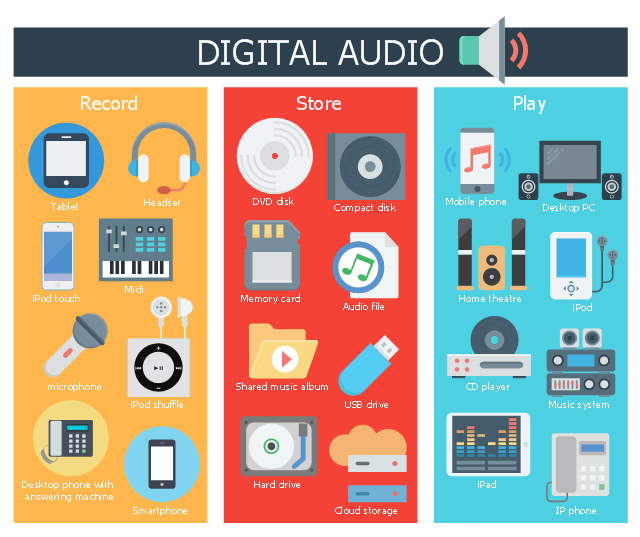
The infographics example "How and where do people listen to music" illustrates 2010 data: 20% - mobile, 39% - PC, 76% - car, and 79% - living room.
The infographics example "How and where do people listen to music" was created using ConceptDraw PRO diagramming and vector drawing software extended with the Audio, Video, Media solution from the Illustration area of ConceptDraw Solution Park.
The infographics example "How and where do people listen to music" was created using ConceptDraw PRO diagramming and vector drawing software extended with the Audio, Video, Media solution from the Illustration area of ConceptDraw Solution Park.
Infographics
Sample Pictorial Chart. Sample Infographics
")
Use Pictorial Infographics solution to draw your own design pictorial infographics documents quick and easy.
HelpDesk
How to Make a Web Page from Infographics in ConceptDraw PRO

Spatial Infographics

HelpDesk
How to Create Management Infographics Using ConceptDraw PRO

ConceptDraw PRO can be used as a tool for creating management infographics. It allows you to draw infographics quickly and easily using the special templates and vector stencils libraries. Infographics can be used to quickly communicate a message, to simplify the presentation of large amounts of data, to see data patterns and relationships, and to monitor changes in variables over time. It can contain bar graphs, pie charts, histograms, line charts, e.t.c.
 Spatial Infographics
Spatial infographics solution extends ConceptDraw PRO software with infographic samples, map templates and vector stencils libraries with design elements for drawing spatial information graphics.
Design Pictorial Infographics. Design Infographics

Best Tool for Infographic Construction

How to draw Metro Map style infographics? (Los Angeles)

This is a one-click tool to add stations to the map. It lets you control the direction in which you create new stations, change lengths, and add text labels and icons. It contains Lines, Stations, and Landmarks objects.
How to draw Metro Map style infographics? Moscow, New York, Los Angeles, London

Travel Infographics

Map Infographic Tool

- How to Create a Powerful Infographic When You do not Have a ...
- Entity-Relationship Diagram (ERD) | How to Create a Powerful ...
- How and where do people listen to music - Infographics
- Map Infographic Creator | Visualization Spatial Data Using Thematic ...
- Map Infographic Creator | Visualization Spatial Data Using Thematic ...
- Spatial infographics Design Elements: Location Map | Design ...
- Map Infographic Creator | How to draw Metro Map style infographics ...
- Spatial infographics Design Elements: Continental Map | Spatial ...
- Spatial infographics Design Elements: Transport Map
- Metro Map | How to draw Metro Map style infographics ? (Moscow ...
- Spatial Infographics | What is Infographics Area | Visualization ...
- Map Infographic Creator | Visualization Spatial Data Using Thematic ...
- UML deployment diagram - Apple iTunes | Infographics - How and ...
- Map Infographic Design
- Spatial Infographics | Spatial Dashboard | Visualization Spatial Data ...
- Subway infographic design elements - software tools ...
- Maps | How to draw Metro Map style infographics ? (London) | How ...
- Music - Vector illustration | Infographics - How and where do people ...
- Maps | Map Infographic Creator | Brilliant Examples of Infographics ...
- How to draw Metro Map style infographics ? (New York) | How to ...