Travel Infographics
Infographics
ConceptDraw DIAGRAM is a software for making travel infographics. The Spatial Infographics solution allows users visually present traavel plans.
The library objects are scalable vector images that can be easily exported to PDF format, Microsoft PowerPoint, Microsoft Visio, graphic image file, or HTML for more comfortable presenting.
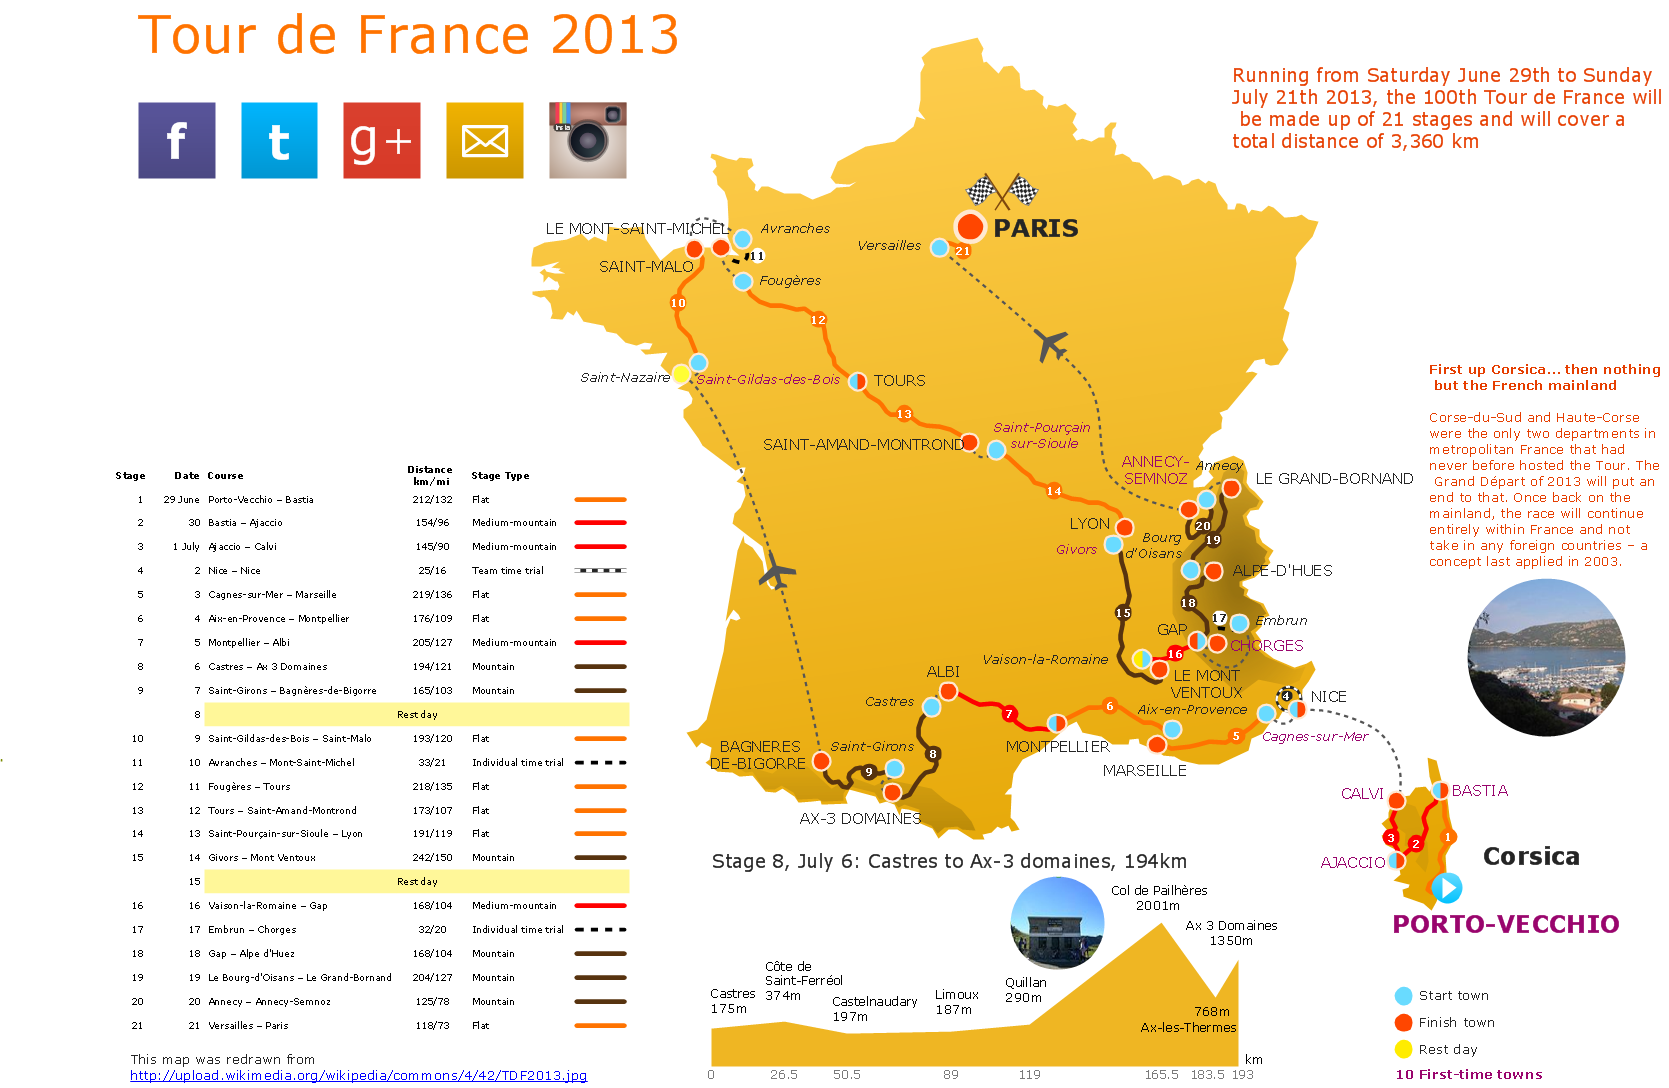
Sample 1. The 100th Tour de France 2013 - Spatial infographics.
Solution Spatial Infographics from ConceptDraw Solution Park extends ConceptDraw DIAGRAM ector diagramming and business graphics software with easy-to-use spatial infographics drawing tools.
This solution contains spatial infographics samples, map templates to be filled in, and libraries of vector stencils for main design elements of spatial infographics.
Use this solution to draw your own geospatial infographics documents with thematic maps, road maps, directional maps, transport maps and travel maps.
THREE RELATED HOW TO's:
ConceptDraw DIAGRAM extended with Pictorial Infographics Solution is the best for Spatial Data Analysis. You have a perfect possibility to make sure this right now.
Picture:
What is Spatial Analysis?
Definition and Examples
Related Solution:
UML Diagrams Social Networking Sites Project. This sample was created in ConceptDraw DIAGRAM diagramming and vector drawing software using the UML Use Case Diagram library of the Rapid UML Solution from the Software Development area of ConceptDraw Solution Park.
This sample shows the Facebook Socio-health system and is used at the projection and creating of the social networking sites.
Picture: UML Use Case Diagram Example. Social Networking Sites Project
Related Solution:
How to Create an Infographic? It’s very easy! All what you need is a powerful infographic software. Never before creation of Infographics wasn’t so easy as now with Typography Infographics Solution from the “Infographics” Area for ConceptDraw Solution Park.
Picture: How to Create an Infographic
Related Solution: