 Maps
Maps
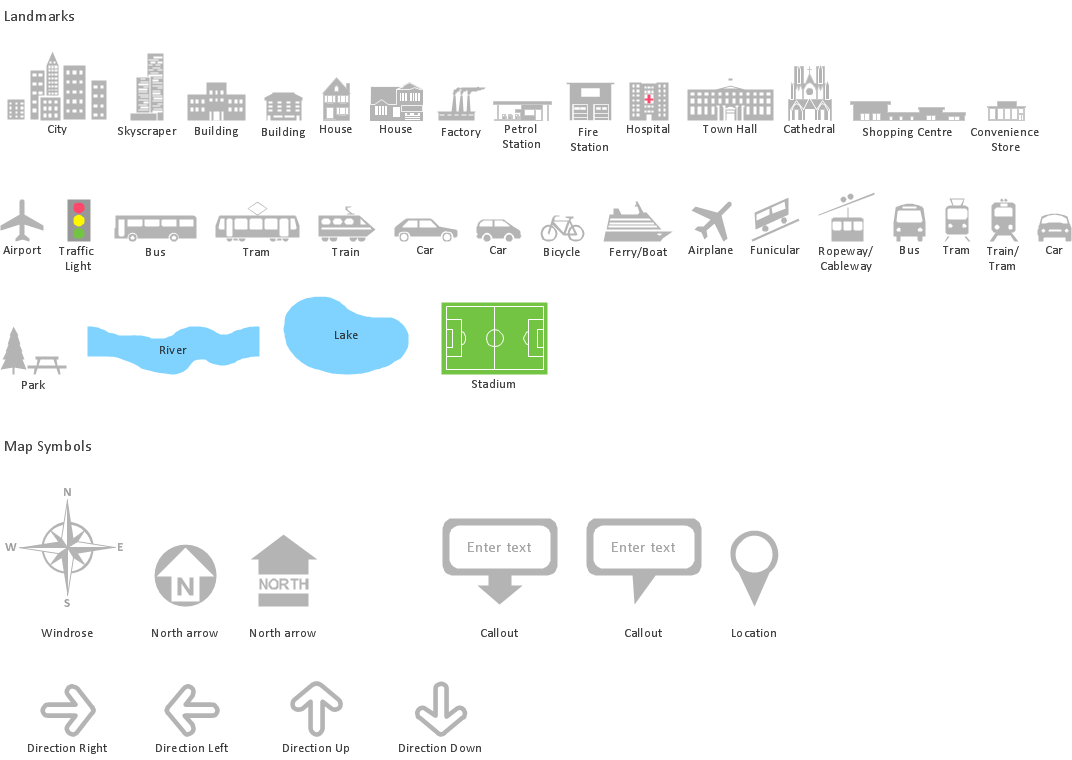
This solution extends ConceptDraw DIAGRAM.4 with the specific tools necessary to help you draw continental, directional, road, or transit maps, to represent international, business, or professional information visually.
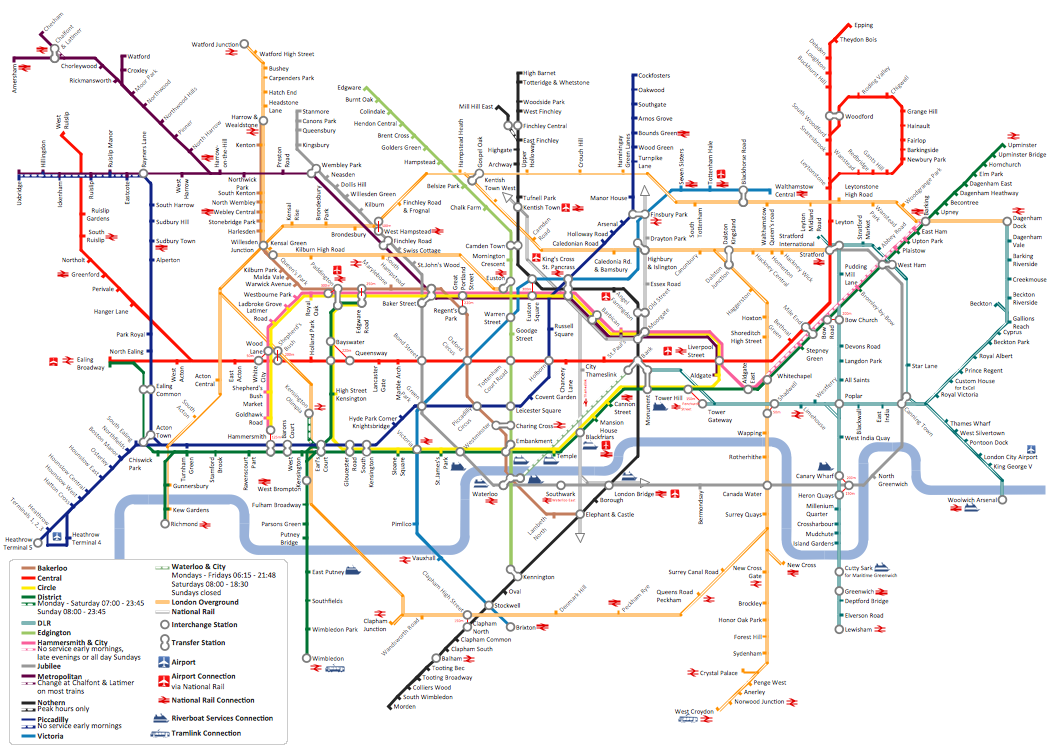
How to draw Metro Map style infographics? (London)
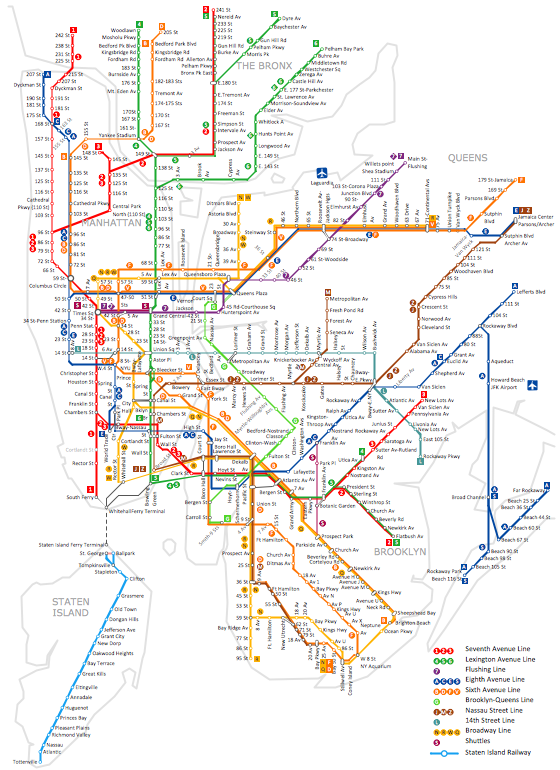
How to draw Metro Map style infographics? (New York)
How to draw Metro Map style infographics? Moscow, New York, Los Angeles, London

 Metro Map
Metro Map solution extends ConceptDraw DIAGRAM software with templates, samples and library of vector stencils for drawing the metro maps, route maps, bus and other transport schemes, or design tube-style infographics.
 Universal Diagramming Area
This area collects solutions for drawing diagrams, charts, graphs, matrices, geographic and road maps for education, science, engineering, business.
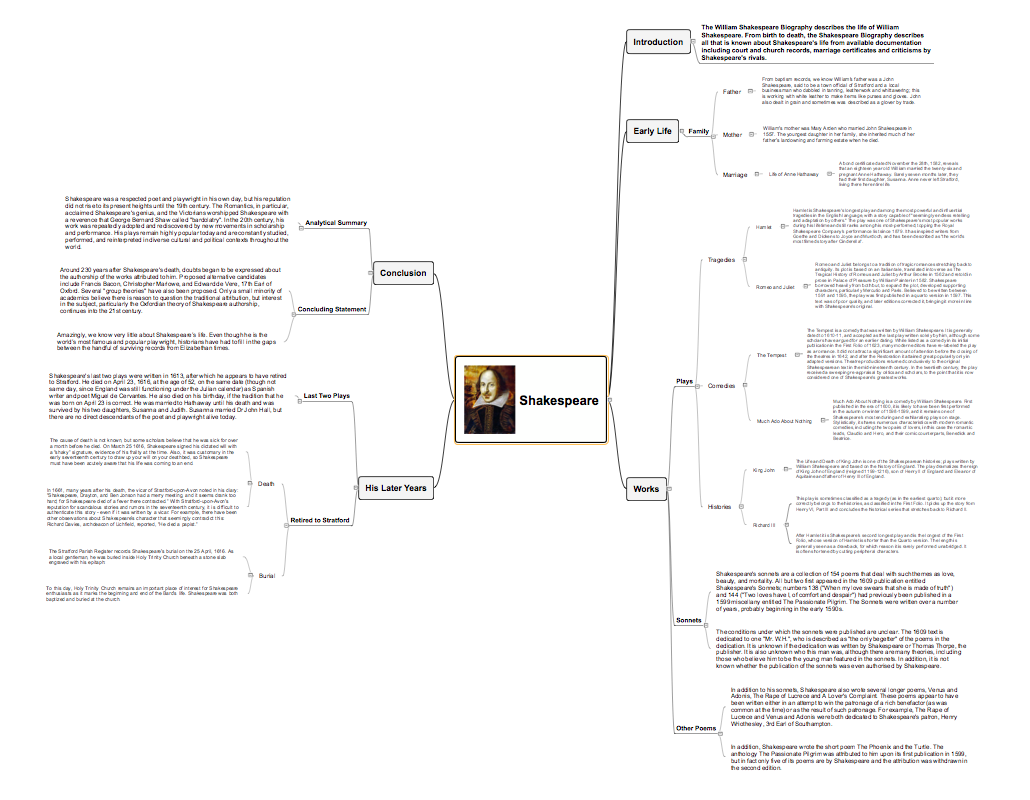
Concept Maps

Map Infographic Creator

Map Infographic Tool

Subway infographic design elements - software tools

Business diagrams & Org Charts with ConceptDraw DIAGRAM


 Value Stream Mapping
Value stream mapping solution extends ConceptDraw DIAGRAM software with templates, samples and vector stencils for drawing the Value Stream Maps (VSM) in lean manufacturing practice.
 Spatial Infographics
Spatial infographics solution extends ConceptDraw DIAGRAM software with infographic samples, map templates and vector stencils libraries with design elements for drawing spatial information graphics.
Spatial infographics Design Elements: Transport Map
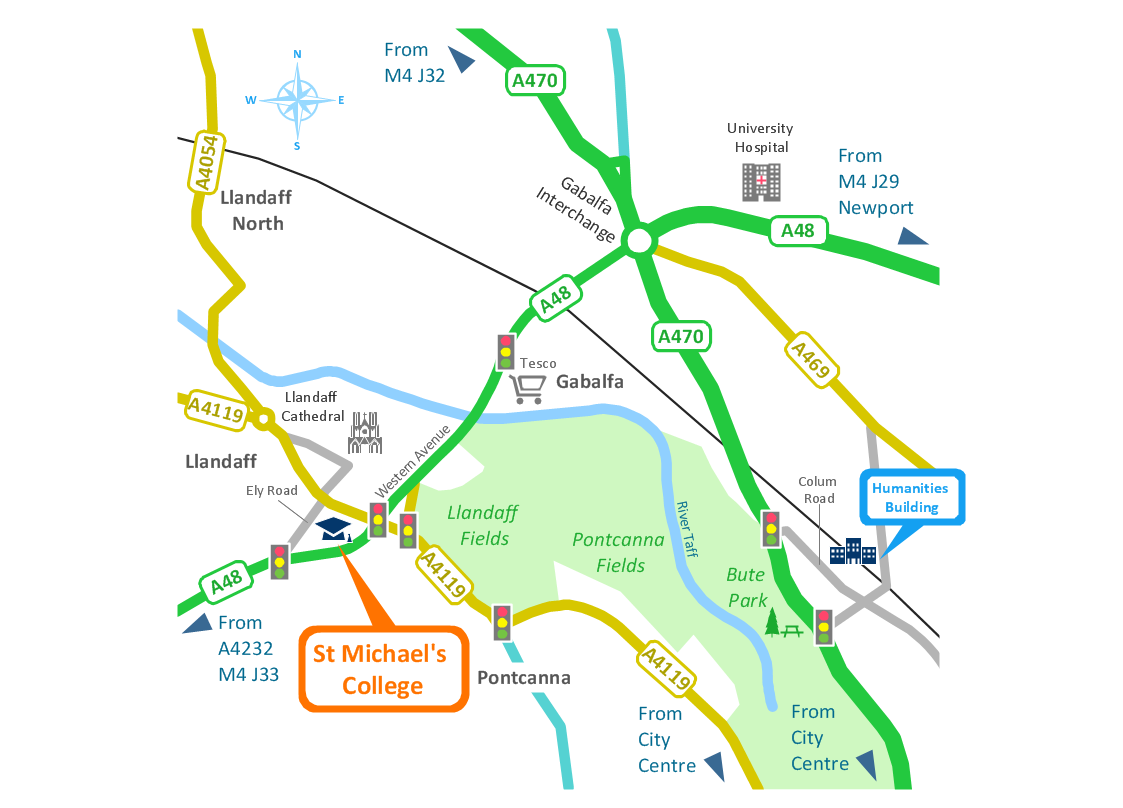
Spatial infographics Design Elements: Location Map
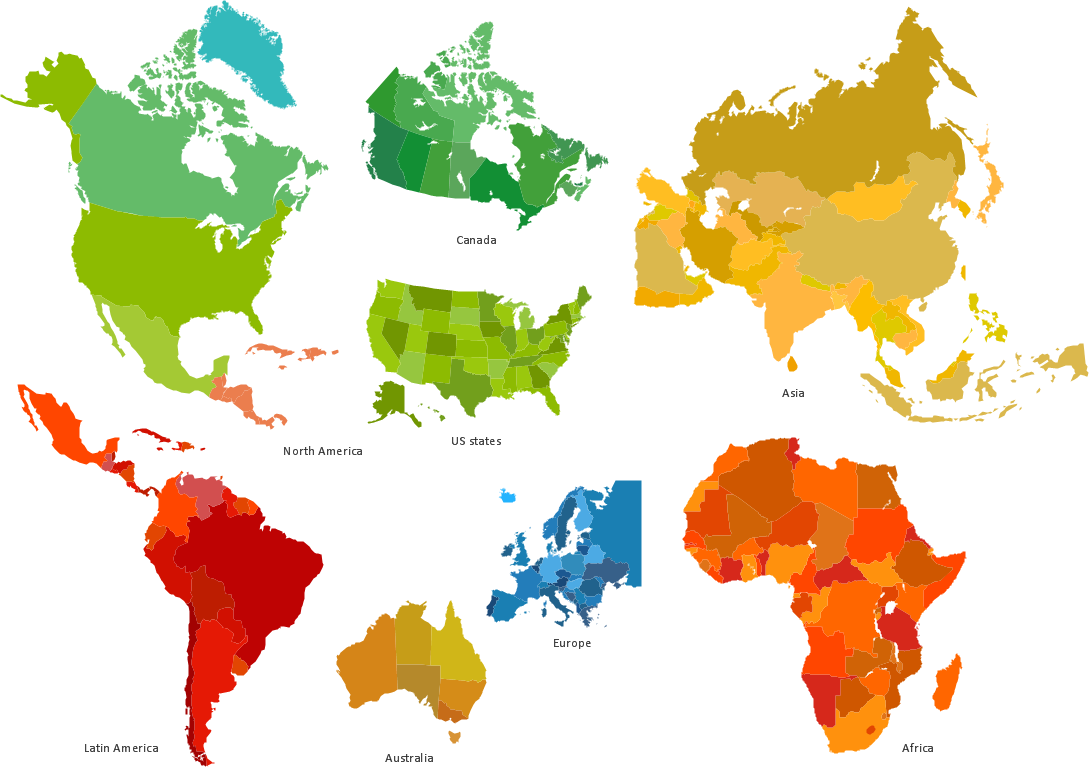
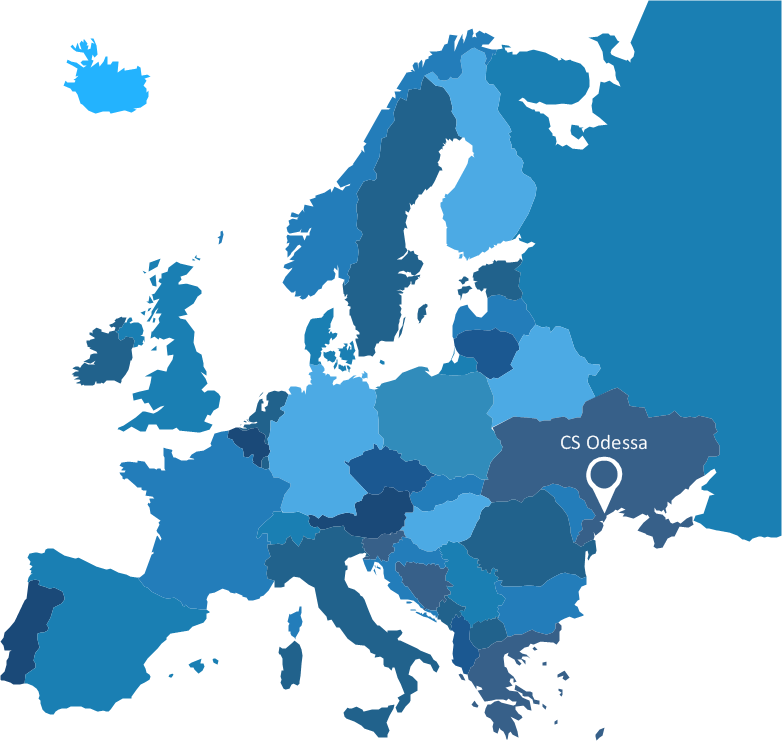
Spatial infographics Design Elements: Continental Map

Map Infographic Design
Visualization Spatial Data Using Thematic Maps Combined with Infographics
Enhancing maps using ConceptDraw MINDMAP ′s Theme Gallery
- Directional Maps | Maps | Neighborhood 3D directional map |
- Maps | Brilliant Examples of Infographics Map , Transport, Road ...
- Neighborhood 3D directional map
- 3D directional map example | Directional Maps | Neighborhood 3D ...
- Maps | Transportation Infographics | How to draw Metro Map style ...
- 3D directional map example
- Maps | Metro Map | Spatial Infographics |
- How to draw Metro Map style infographics? Moscow, New York, Los ...
- Infographic design elements, software tools Subway and Metro style ...
- Maps | Metro Map | How to draw Metro Map style infographics ...
- Metro Map | Maps | How to draw Metro Map style infographics ...
- Spatial infographics Design Elements: Transport Map | Maps | Metro ...
- Transportation Infographics | How to draw Metro Map style ...
- Europe map template | Map Infographic Creator | Political map of ...
- Value Stream Mapping | Concept maps with ConceptDraw PRO ...
- Infographic design elements, software tools Subway and Metro style ...
- Value Stream Mapping | Metro Map | Mind Map Exchange |
- Maps | Idea Communication | ConceptDraw Solution Park is an ...
- Continent Maps | Spatial infographics Design Elements: Location ...