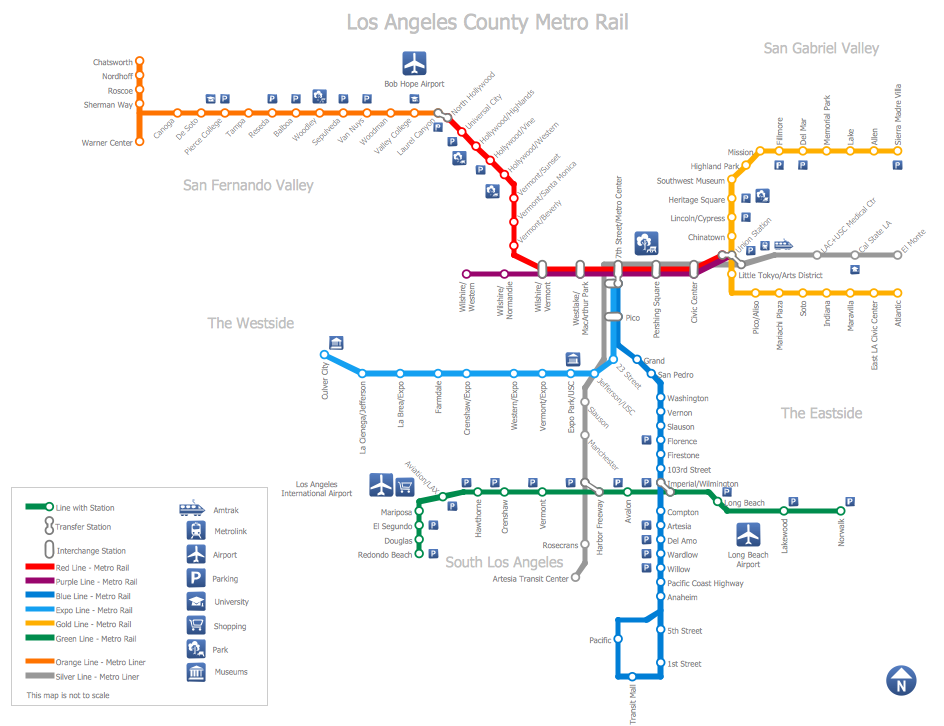
Metro Rail is a rapid transit rail system consisting of six separate lines serving 80 stations.
About this sample:
- The sample you see on this page was created in ConceptDraw DIAGRAM using the Metro Map solution, and demonstrate the solutions capabilities and the results you can achieve using this solution.
- This map was created in ConceptDraw DIAGRAM using the Transport Map library from the Metro Map solution. An experienced user spent less than 3 hours creating such complex chart.
- All source documents are vector graphic documents. They are available for reviewing, modifying or converting to a variety of formats (PDF file, Power point Presentation, image or MS Visio) from ConceptDraw STORE, for all users who have installed Metro Map solution.
See also:
Video Tutorial "How to draw Metro Map style infographics?"
Tutorial explains Metro Map tools, demonstrate how to add stations to the map, control the direction in which you create new stations, change lengths, add text, Lines and Landmarks objects. This video demonstrate ConceptDraw Metro Map Solution.
TEN RELATED HOW TO's:
When you need a drawing software to create a professional looking cross-functional charts, ConceptDraw with its Arrows10 Technology - is more than enough versatility to draw any type of diagram with any degree of complexity.
Use templates with process maps, diagrams, charts to get the drawing in minutes.
Picture: Cross-Functional Process Map Template
Electrical plan is a document that is developed during the first stage of the building design. This scheme is composed of conventional images or symbols of components that operate by means of electric energy. To simplify the creation of these schemes you can use house electrical plan software, which will not require a long additional training to understand how to use it. You only need to install the necessary software ant it’s libraries and you’ll have one less problem during the building projection.
Any building contains a number of electrical systems, including switches, fixtures, outlets and other lightening equipment. All these should be depicted in a building electrical plans and included to general building documentation. This home electrical plan displays electrical and telecommunication devices placed to a home floor plan. On the plan, each electrical device is referenced with the proper symbol. Electrical symbols are used for universal recognition of the building plan by different persons who will be working on the construction. Not all possible electric symbols used on a certain plan, so the symbols used in the current home plan are included to a legend. The electrical home plan may be added as a separate document to a complete set of building plans.
Picture: How To use House Electrical Plan Software
Related Solution:
Computer networks nowadays are spread all across the world. The large number of parameters, such as geographic scale or communication protocols, can divide networks. One of the most common types of networks is called local area network (LAN). It convenient to represent network examples by means of diagrams.
This local area network (LAN) diagram provides an easy way to see the way the devices in a local network are interacted. The diagram uses a library containing specific symbols to represent network equipment , media and the end-user devices such as computers (PC, mac, laptop) , network printer, hubs, server and finally a modem. There are two types of network topologies: physical and logical. The current diagram represents precisely a physical type of LAN topology because it refers to the physical layout of a local network equipment.
Picture:
What is a Local Area Network?
Examples of LAN Diagrams
Related Solution:
Choose the business illustration design you love best, and sign our design your own style with Business and Finance Illustrations library from ConceptDraw DIAGRAM.
The Business and Finance solution contains 12 vector clipart libraries: Advertising, Business, Business people clipart, Business people figures, Currency, Mail and post, Management, Marketing, Money, Office, Project management, Time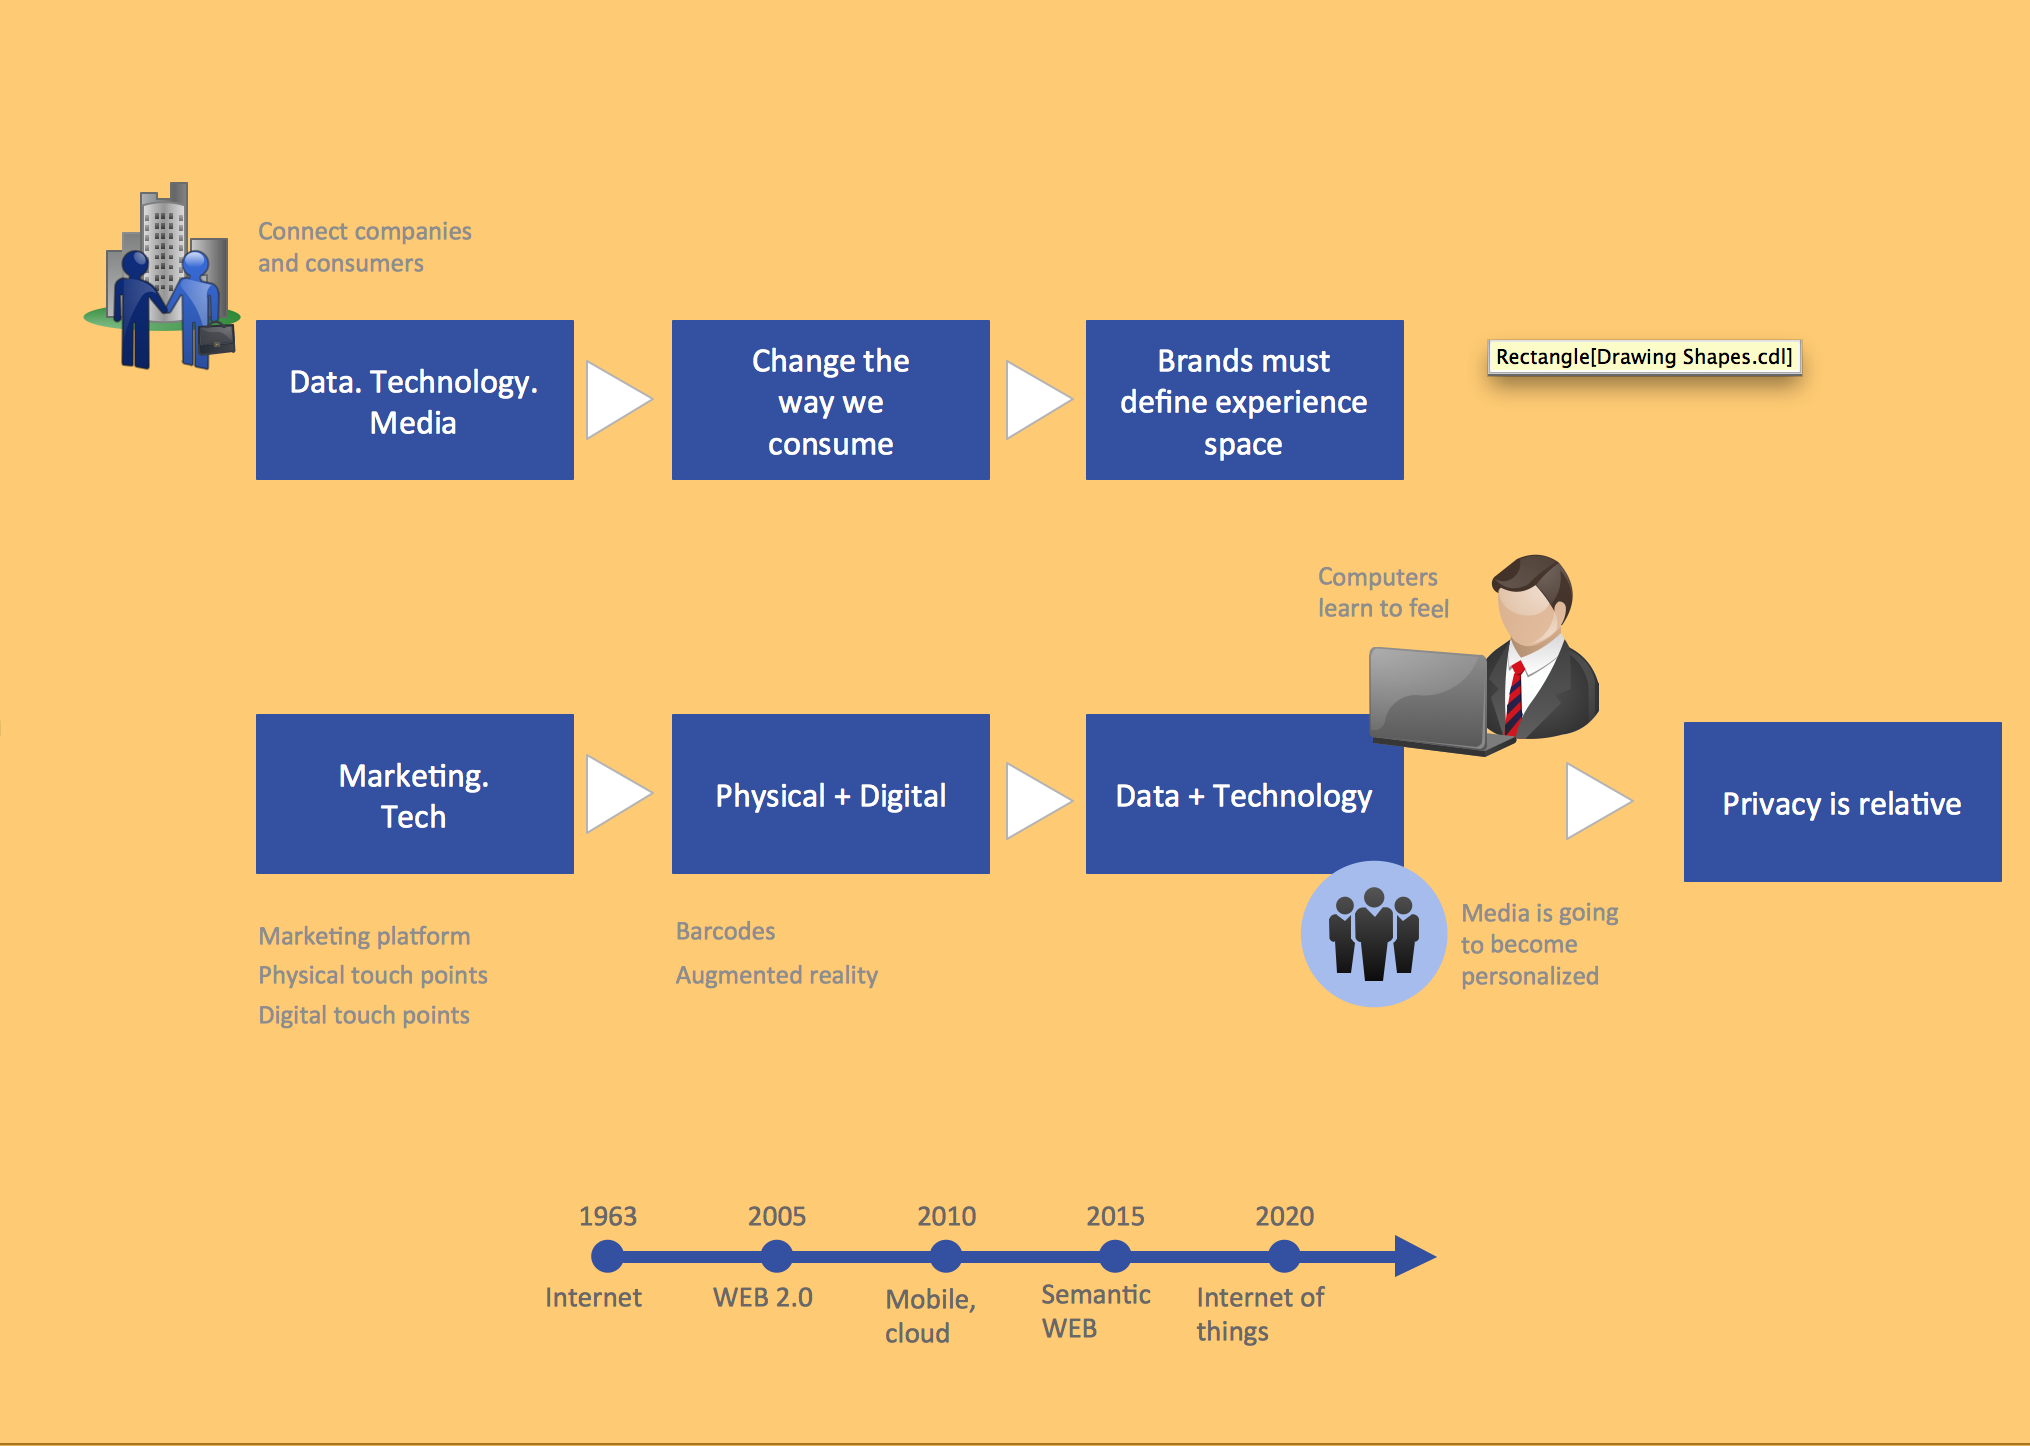
Picture: Business and Finance Illustrations
Related Solution:
Planning a computer network can be a challenge for a junior specialist. However, knowing how to draw a computer network diagrams isn’t a rocket science anymore. There are a lot of special software for creating such diagrams with predesigned templates and examples.
The core for Network Fault Tolerance System presented here, is the equipment of Cisco. You can see here the certified Cisco equipment icons. Generally, ConceptDraw DIAGRAM libraries contain more than half of a thousand objects representing the standardized images of Cisco equipment. ConceptDraw solution for network diagramming is a great network diagramming tool for any level skills - from students to network guru.
Picture: How to Draw a Computer Network Diagrams
Related Solution:
How To Draw an iPhone? It's very fast and easy to draw an iPhone and design iPhone user interface using the tools of ConceptDraw DIAGRAM extended with iPhone User Interface Solution. iPhone User Interface Solution offers you the incredibly large quantity of predesigned objects that are grouped to 9 libraries: Apps Icons, Bars, Content Views, Controls, iMessage, iPhone 6 Mockup, Tab Bar Icons, Temporary Views, Toolbar and Navigation Bar Buttons.
Picture: How To Draw an iPhone?
Related Solution:
Design illustrative maps and explore the geographic diversity of American continents. Create detailed maps of North America, South America, Central America, USA, and thematic maps based on them for presentations, websites, social media, reports, marketing materials, educational materials, business documents
Picture: Geo Map of Americas
Related Solution:
Not everyone can make spatial infographics from scratch, ConceptDraw will help you to create your own infographics.
Picture: Spatial Infographics
It’s very important for any establishment to have a fire exit plan and to train it several times a year. The plan must be put on each floor of the building in a way that it could be easily seen. To make the plan clear and descriptive, you should look through examples and then create one for you your building.
Find out the fire exit plan example created with ConceptDraw DIAGRAM and its Fire and Emergency Plans solution. This plan is a floor plan that shows the ways in which people inside the building can be evacuated in the event of a fire. The location of telephones, fire extinguishers and first aid kits are indicated on the fire exit plan. The Legend in the lower right corner of the plan makes it clear and easy-to-read. Such plan should be placed on the wall on each floor of the building.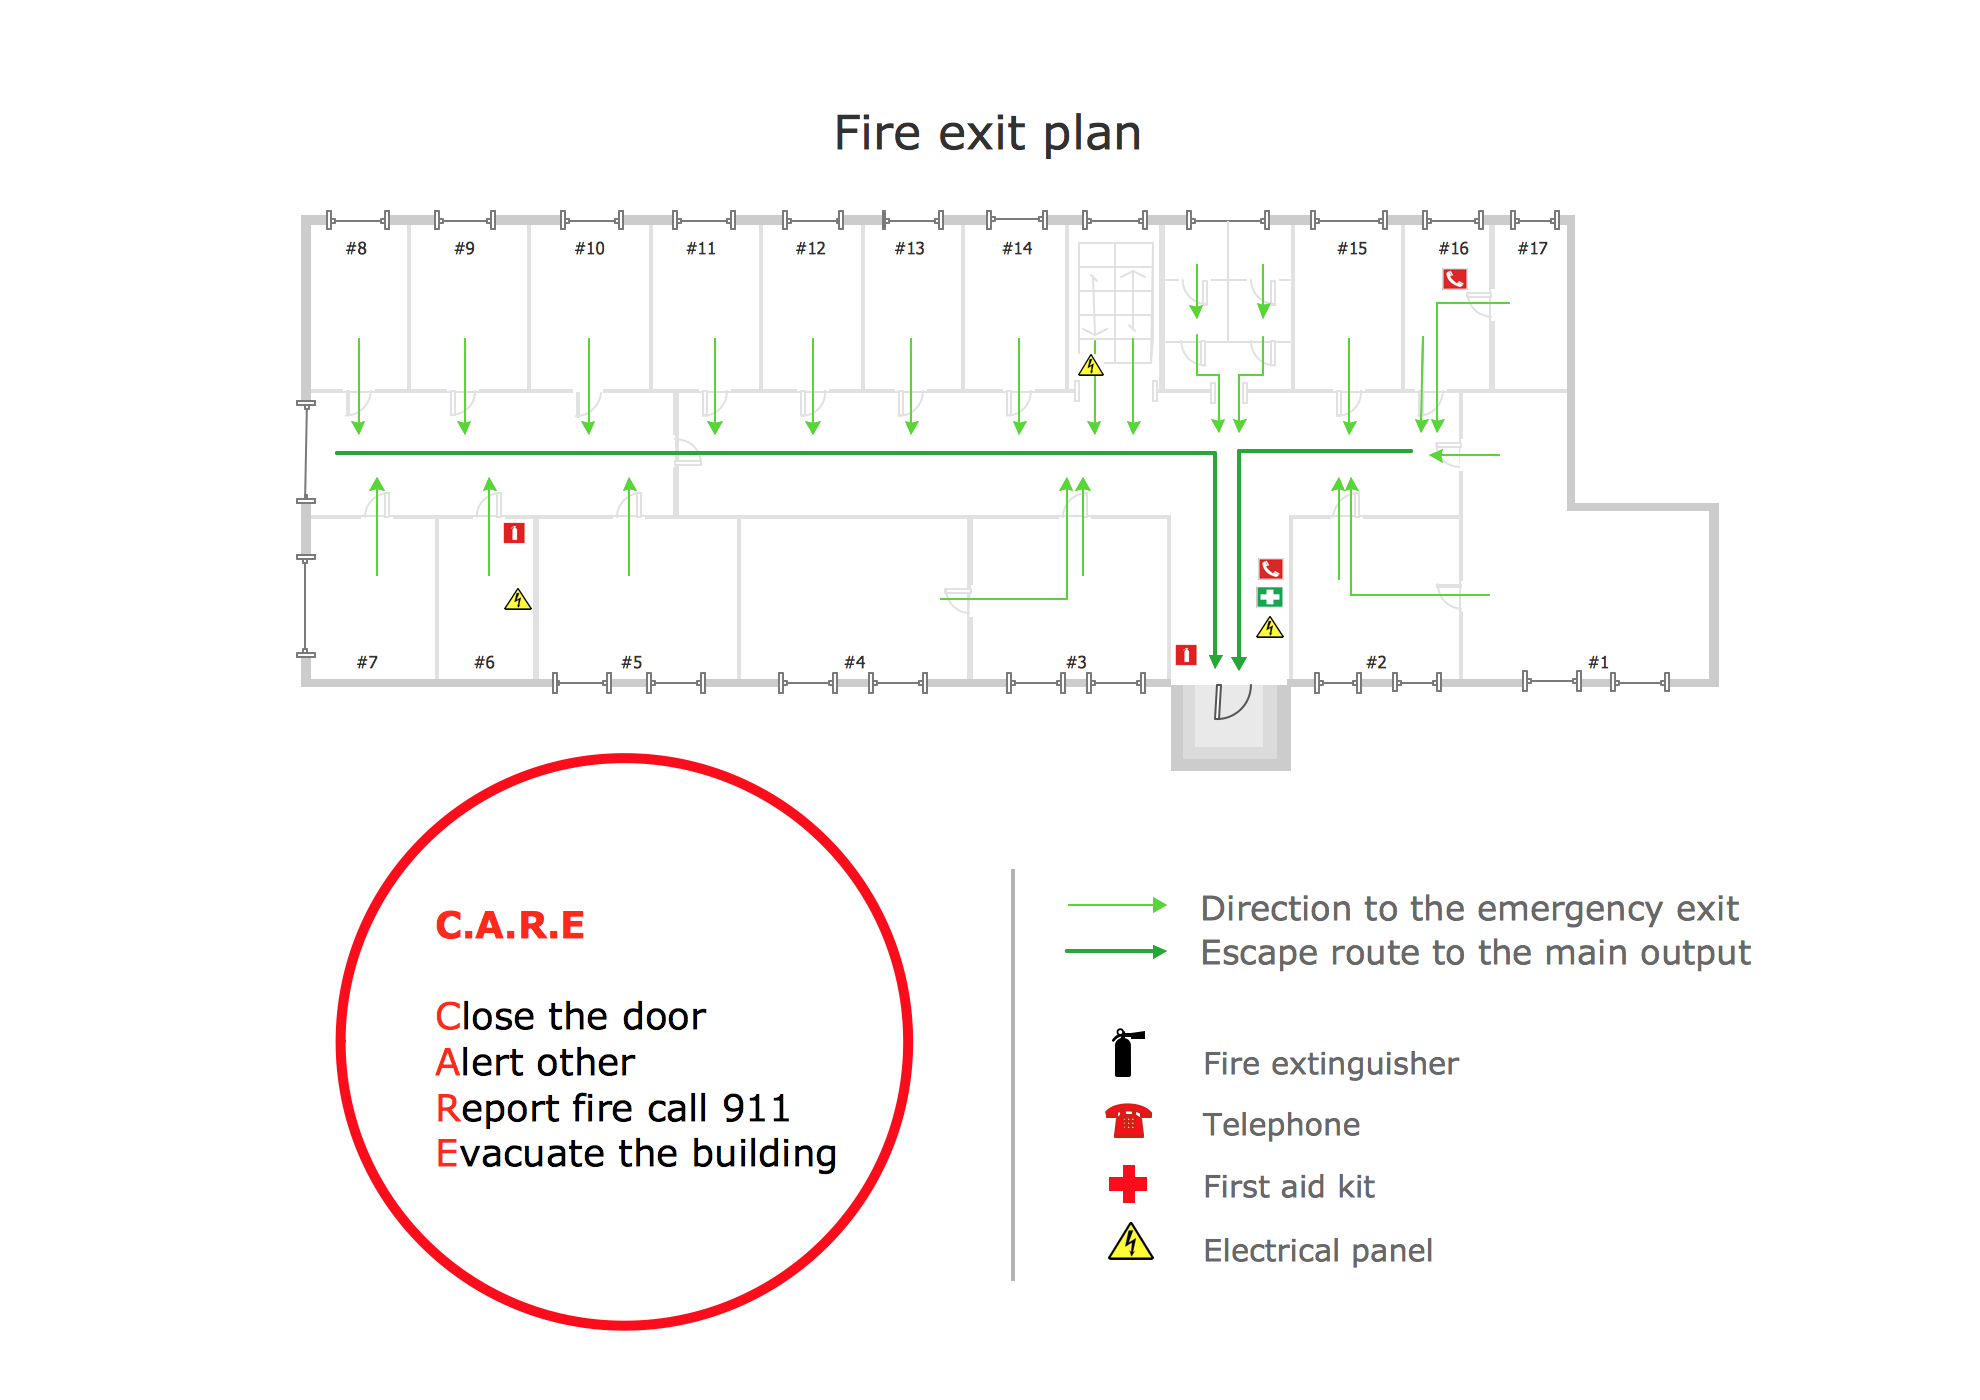
Picture: Fire Exit Plan. Building Plan Examples
Related Solution:
Use building drawing software to develop the annotated diagrams or schematics of waste water disposal systems, hot and cold water supply systems, water lines and waste water engineering.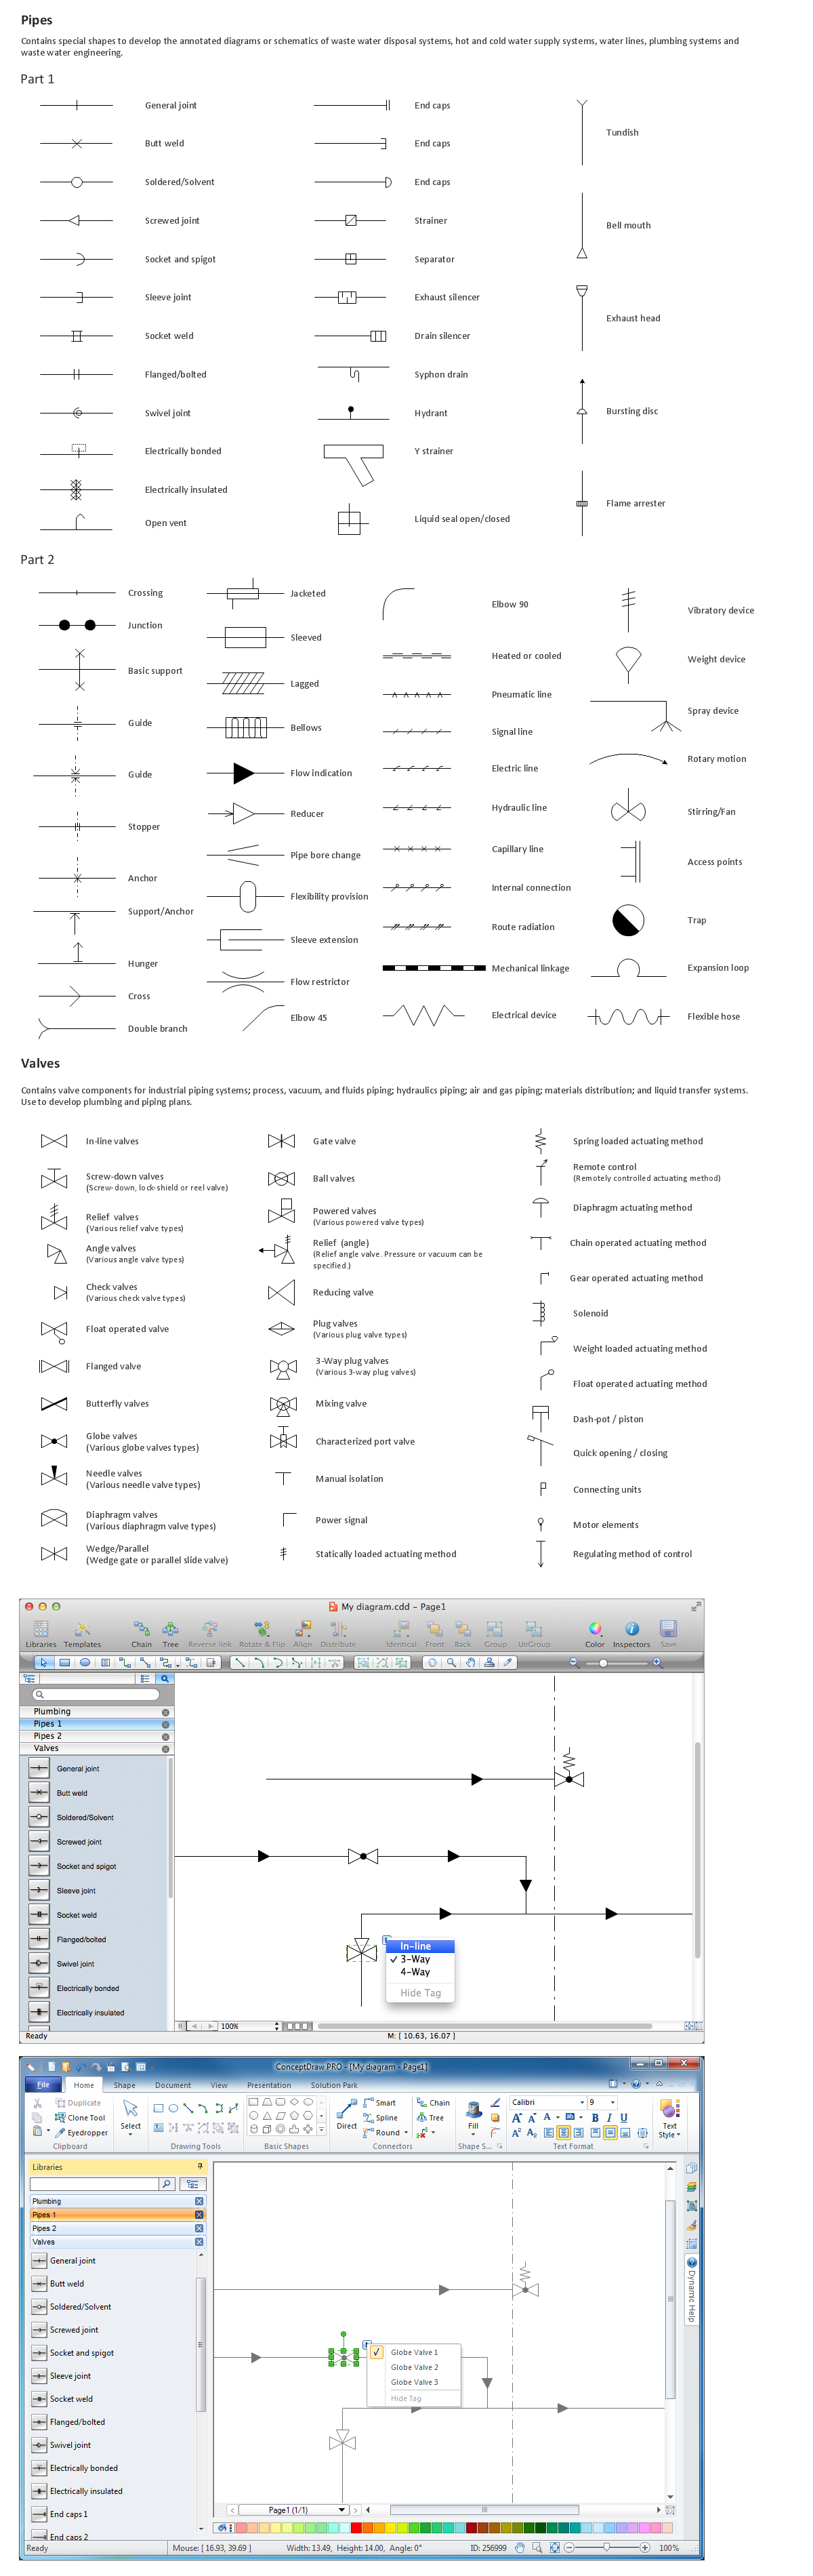
Picture: Building Drawing Software for Design Piping Plan
Related Solution: