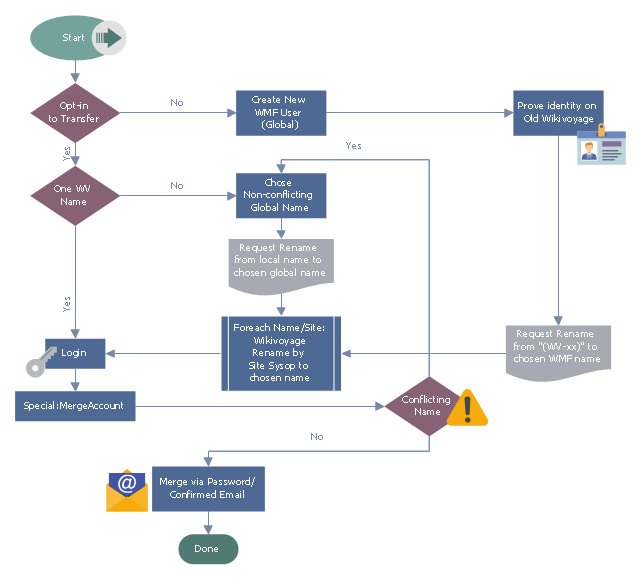
This flowchart example was designed on the base of the Wikimedia Commons file: Wikivoyage Global ID Workflow.svg.
"Workflow for getting a global username for Wikivoyage users migrating to WMF." [commons.wikimedia.org/ wiki/ File:Wikivoyage_ Global_ ID_ Workflow.svg]
This file is licensed under the Creative Commons Attribution-Share Alike 3.0 Unported license. [creativecommons.org/ licenses/ by-sa/ 3.0/ deed.en]
"Your global account (also called unified login or SUL/ single user login) is your single username reserved across all Wikimedia projects (except some special wikis). This gives you a consistent identity throughout Wikimedia, enables features like global user pages, reduces vectors for impersonation, and lets you visit many projects without manually logging in on each wiki." [meta.wikimedia.org/ wiki/ Help:Unified_ login]
The flowchart example "Wikivoyage Global ID Workflow" was created using ConceptDraw PRO software extended with the Business Process Workflow Diagrams solution from the Business Processes area of ConceptDraw Solution Park.
Business process flowchart
Basic Flowchart Symbols and Meaning


Pyramid Diagram

Basic Network Diagram


Network Topologies


This work flow chart sample was redesigned from the picture "Weather Forecast" from the article "Simulation Workflows".
[iaas.uni-stuttgart.de/ forschung/ projects/ simtech/ sim-workflows.php]
"(1) The weather is predicted for a particular geological area. Hence, the workflow is fed with a model of the geophysical environment of ground, air and water for a requested area.
(2) Over a specified period of time (e.g. 6 hours) several different variables are measured and observed. Ground stations, ships, airplanes, weather balloons, satellites and buoys measure the air pressure, air/ water temperature, wind velocity, air humidity, vertical temperature profiles, cloud velocity, rain fall, and more.
(3) This data needs to be collected from the different sources and stored for later access.
(4) The collected data is analyzed and transformed into a common format (e.g. Fahrenheit to Celsius scale). The normalized values are used to create the current state of the atmosphere.
(5) Then, a numerical weather forecast is made based on mathematical-physical models (e.g. GFS - Global Forecast System, UKMO - United Kingdom MOdel, GME - global model of Deutscher Wetterdienst). The environmental area needs to be discretized beforehand using grid cells. The physical parameters measured in Step 2 are exposed in 3D space as timely function. This leads to a system of partial differential equations reflecting the physical relations that is solved numerically.
(6) The results of the numerical models are complemented with a statistical interpretation (e.g. with MOS - Model-Output-Statistics). That means the forecast result of the numerical models is compared to statistical weather data. Known forecast failures are corrected.
(7) The numerical post-processing is done with DMO (Direct Model Output): the numerical results are interpolated for specific geological locations.
(8) Additionally, a statistical post-processing step removes failures of measuring devices (e.g. using KALMAN filters).
(9) The statistical interpretation and the numerical results are then observed and interpreted by meteorologists based on their subjective experiences.
(10) Finally, the weather forecast is visualized and presented to interested people." [iaas.uni-stuttgart.de/ forschung/ projects/ simtech/ sim-workflows.php]
The example "Workflow diagram - Weather forecast" was drawn using the ConceptDraw PRO diagramming and vector drawing software extended with the Workflow Diagrams solution from the Business Processes area of ConceptDraw Solution Park.
Work flow chart

Pyramid Diagram

Fundraising Pyramid

Hotel Network Topology Diagram

Pyramid Diagram

Venn Diagram Examples for Problem Solving. Environmental Social Science. Human Sustainability Confluence

Bar Diagrams for Problem Solving. Create business management bar charts with Bar Graphs Solution

Pyramid Chart Examples

Business Process Elements: Choreographies
")

- Sales Process Flowchart . Flowchart Examples | Basic Flowchart ...
- Article creation process workflows | UML Diagram | Wikivoyage ...
- Sales Process Flowchart . Flowchart Examples | Global Payment ...
- Sales Process Flowchart . Flowchart Examples | Basic Flowchart ...
- Sales Process Flowchart . Flowchart Examples | Basic Flowchart ...
- Login and registration processing - EPC diagram | Flowchart ...
- Food security assessment - Flowchart | Weather - Vector stencils ...
- Invoice payment process - Flowchart | Accounting Flowchart ...
- Pyramid Diagram | Global liquidity inverted pyramid diagram ...
- Invoice payment process - Flowchart | Accounting Flowchart ...
- Trading process diagram - Deployment flowchart
- Pyramid Diagram | Pyramid Diagram | Process Flowchart | Chart Of ...
- Global networks - Vector stencils library | Vehicular Networking ...
- Global competitiveness index infrastructure score | Sales ...
- Basic Flowchart Symbols and Meaning | Network Diagrams for ...
- Bank Detailed Answers | UML activity diagram - Cash withdrawal ...
- Trading process diagram - Deployment flowchart | Settlement ...
- Cloud Computing diagram | Cloud applications | Mobile cloud ...
- UML use case diagram - System of goods selling via catalogues ...
- Sales Process Flowchart . Flowchart Examples | Block diagram ...