HelpDesk
How to Draw a Line Chart Quickly

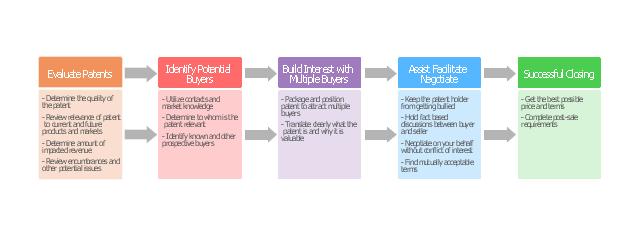
"A patent ... is a set of exclusive rights granted by a sovereign state to an inventor or assignee for a limited period of time in exchange for detailed public disclosure of an invention. An invention is a solution to a specific technological problem and is a product or a process. Patents are a form of intellectual property.
The procedure for granting patents, requirements placed on the patentee, and the extent of the exclusive rights vary widely between countries according to national laws and international agreements. Typically, however, a granted patent application must include one or more claims that define the invention. A patent may include many claims, each of which defines a specific property right. These claims must meet relevant patentability requirements, such as novelty and non-obviousness. The exclusive right granted to a patentee in most countries is the right to prevent others from making, using, selling, importing, or distributing a patented invention without permission.
Under the World Trade Organization's (WTO) Agreement on Trade-Related Aspects of Intellectual Property Rights, patents should be available in WTO member states for any invention, in all fields of technology, and the term of protection available should be a minimum of twenty years. Nevertheless, there are variations on what is patentable subject matter from country to country." [Patent. Wikipedia]
The step chart example "Selling technology patent process" was created using the ConceptDraw PRO diagramming and vector drawing software extended with the Block Diagrams solution from the area "What is a Diagram" of ConceptDraw Solution Park.
Step chart
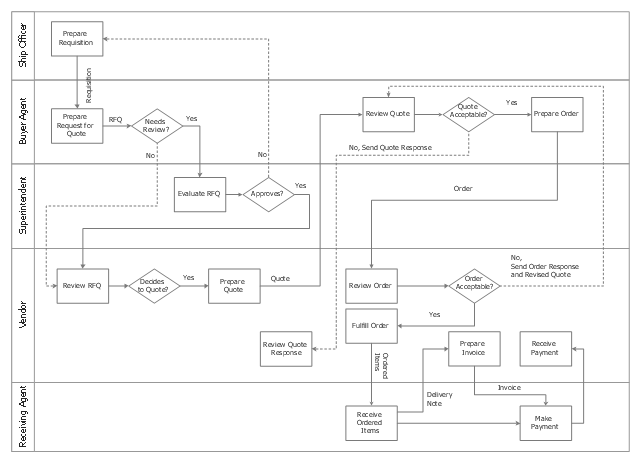
This swim lane diagram sample shows the trading process flow.
"Trade, also called goods exchange economy, is to transfer the ownership of goods from one person or entity to another by getting something in exchange from the buyer. Trade is sometimes loosely called commerce or financial transaction or barter. A network that allows trade is called a market. ...
Modern traders ... generally negotiate through a medium of exchange, such as money. As a result, buying can be separated from selling, or earning. ...
Retail trade consists of the sale of goods or merchandise from a very fixed location, such as a department store, boutique or kiosk, or by mail, in small or individual lots for direct consumption by the purchaser. Wholesale trade is defined as the sale of goods that are sold merchandise to retailers, to industrial, commercial, institutional, or other professional business users, or to other wholesalers and related subordinated services." [Trade. Wikipedia]
The swimlane diagram example "Process flowchart - Trading process" was created using the ConceptDraw PRO diagramming and vector drawing software extended with the Process Flowcharts solution from the Business Processes area of ConceptDraw Solution Park.
Swim lane diagram
- Trading process diagram - Deployment flowchart | Cross-Functional ...
- Flow Chart And Diagram On Retail And Wholesale Trade
- Cross-Functional Flowcharts | Flow Chart Creator | Financial Trade ...
- Process Flowchart | Flow chart Example. Warehouse Flowchart ...
- Cross-Functional Flowcharts | Flow Chart Creator | Financial Trade ...
- Trading process diagram - Deployment flowchart
- Process flowchart - Trading process | Flow chart Example ...
- Process flowchart - Trading process | Business diagrams & Org ...
- Process flowchart - Trading process | Business Process Diagrams ...