Bar Diagrams for Problem Solving. Create event management bar charts with Bar Graphs Solution

This workflow diagram example was designed on the base of Wikimedia Commons file: Article creation workflows (enwiki).svg.
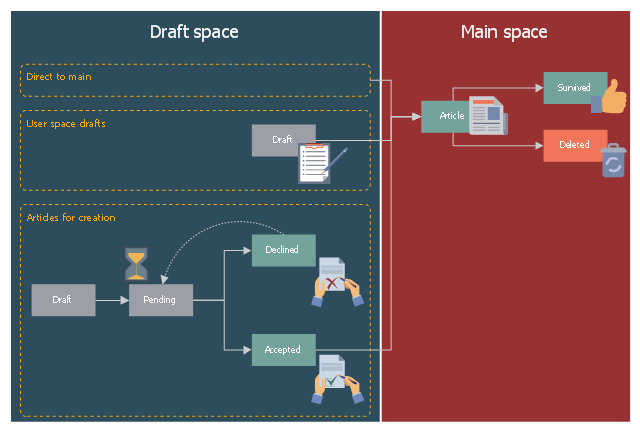
"Article creation process workflows for English Wikipedia are presented as a directed graph and split into "draft space" and "main space"." [commons.wikimedia.org/ wiki/ File:Article_ creation_ workflows_ %28enwiki%29.svg]
This file is licensed under the Creative Commons Attribution-Share Alike 4.0 International license. [creativecommons.org/ licenses/ by-sa/ 4.0/ deed.en]
"An encyclopedia or encyclopaedia (also spelled encyclopædia, see spelling differences) is a type of reference work or compendium holding a comprehensive summary of information from either all branches of knowledge or a particular branch of knowledge. Encyclopedias are divided into articles or entries, which are usually accessed alphabetically by article name. Encyclopedia entries are longer and more detailed than those in most dictionaries. Generally speaking, unlike dictionary entries, which focus on linguistic information about words, encyclopedia articles focus on factual information concerning the subject for which the article is named." [Encyclopedia. Wikipedia]
The workflow diagram example "Article creation process workflows" was created using ConceptDraw PRO software extended with the Business Process Workflow Diagrams solution from the Business Processes area of ConceptDraw Solution Park.
Workflow diagram
Pyramid Diagram

Venn Diagram Examples for Problem Solving

Pyramid Diagram

Material Requisition Flowchart. Flowchart Examples

Bar Diagrams for Problem Solving. Create business management bar charts with Bar Graphs Solution

Model Based Systems Engineering

Bar Diagrams for Problem Solving. Create manufacturing and economics bar charts with Bar Graphs Solution

 Business Process Workflow Diagrams
The Business Process Workflow Diagrams solution enhances the ConceptDraw DIAGRAM functionality with predesigned examples, samples and a numerous collection of predesigned vector objects of workflow chart elements, icons, arrows, connectors, and varied wor
Pyramid Diagram

Pyramid Diagram

Pyramid Diagram

Pyramid Diagram

Business Process Workflow Diagram


- Design elements - Time | Design elements - Workflow management ...
- Human Resources Management Wiki
- Components of competency based management | Talent ...
- Management Wikipedia The
- Workflow - Lead to Opportunity | Lead to opportunity sales flow ...
- Project Cycle Management Wikipedia
- Article creation process workflows | Event-driven Process Chain ...
- Talent management process | HR Flowcharts | HR Management ...
- Hiring Process | Recruitment | Business process diagram BPMN 1.2 ...
- Human Resource Management | HR Flowchart Symbols | Flowchart ...
- Workflow - Lead to Opportunity | Lead to opportunity sales flow ...
- Creative Workflow Management Software
- Global Management Consulting
- Post Employment Committee recruitment flowchart | HR Flowcharts ...
- Diagram Of It Project Management
- Wiki Workflow
- HR management process - Flowchart | Types of Flowchart ...
- Sales workflow - Vector stencils library | Sales Process Flowchart ...
- Electronic human resources (E-HR) | Hiring process workflow ...