Gant Chart in Project Management
Gant Chart is a graphical representation of tasks as segments on a time scale. It helps plan and monitor project development or resource allocation. The horizontal axis is a time scale, expressed either in absolute or relative time.Gantt chart examples
All Gantt charts were made using ConceptDraw PROJECT. ConceptDraw PROJECT works both on Windows and Mac OS X. It allows to schedule a voluntary number of projects in a single Workspace document and lets easily share tasks and resources among them. ConceptDraw PROJECT shares files among Windows and Mac OS X.Gantt Chart Software
ConceptDraw PROJECT is a powerful Gantt Chart Software. The Gantt Charts are useful for displaying a large amount of detailed information, project tasks and timelines in a visually pleasing, easy-to-understand format.ConceptDraw PROJECT provides wide capabilities of importing and exporting in various formats: Microsoft Project, ConceptDraw MINDMAP , Mindjet MindManager, PDF file.
What is Gantt Chart (historical reference)
Historical reference about the Gantt chart.Sample Project Flowchart. Flowchart Examples
This sample shows the Flowchart that displays the architecture of SQL Exception Translation.This sample was created in ConceptDraw DIAGRAM diagramming and vector drawing software using the Flowcharts solution from the Diagrams area of ConceptDraw Solution Park.
PM Planning
The PM Planning solution extends the functional abilities of ConceptDraw MINDMAP and ConceptDraw PROJECT software, allowing to automatically create the spreadsheets reflecting the tasks and project statuses for people who have different project roles. The reporting capabilities of this solution are represented by the possibility to generate a wide range of project reports that allow the project managers, senior management and other project participants to be informed on a project daily progress and monthly objectives: All Inclusive Report, All Visible Columns, Milestones with Notes and Objectives, Projects Goals, Projects Managers, Project Team, and Top Level Tasks. The PM Planning solution from ConceptDraw Solution Park is a strong project management and productivity tool which simplifies the process of reporting and lets one create a document with the desired report, includes the predesigned examples, extends and improves the planning capabilities for all team members, improves the project communication, helps to accurately plan, maintain, and finish projects on time, to track the work of project resources, to perform the analytical work and to make effective decisions.
PM Presentations
The PM Presentations solution extends the power of ConceptDraw MINDMAP , ConceptDraw DIAGRAM , and ConceptDraw PROJECT, improving their efficiency at many stages of the project management process by using the same source data to construct the targeted presentation for your audience and clearly communicating the appropriate information to different audiences from a single source. It gives an ability to project managers and other team participants to create and to deliver capacious presentations representing the data and knowledge of a specific project with the help of including visual dashboards, Gantt charts, resource views, maps, timelines, calendars, illustrations, project diagrams and reports of varied types. Having the possibility to edit collaboratively in a Full-Screen Mode, the teams can rapidly plan a project as well as execute the tasks of revising and making changes to it.
Examples of Flowcharts, Org Charts and More
ConceptDraw examples covers a broad spectrum of business graphics categories. We separated all the graphic documents on application areas and had produced multiple solutions for each of them. ConceptDraw provides a wide variety of examples such as flowcharts, organizational charts, business charts, UML diagrams, database and ERD, directional map, network diagrams and lots more. Each solution accommodates 10+ examples that shows specific application cases of a diagram. ConceptDraw STORE is an application for downloading solutions with examples, templates and stencil libraries. Please choose any examples you are interested in, alternatively download them for free; you will need to install ConceptDraw to view them. As you will see, ConceptDraw is very powerful, you can use more than 10000 symbols, examples, and many pre-drawn templates, to create your own spectacular flowcharts, business diagrams, network diagrams and lots more, effortlessly, and in no time at all.UML Class Diagram Example - Buildings and Rooms
This sample was created in ConceptDraw DIAGRAM diagramming and vector drawing software using the UML Class Diagram library of the Rapid UML Solution from the Software Development area of ConceptDraw Solution Park.This sample shows the structure of the building and can be used by building companies, real estate agencies, at the buying / selling of the realty.
Business Diagram Software
ConceptDraw business diagram Software is the most powerful business and relational charting software. Create advanced, completely customizable flow charts, organizational charts, business process diagrams, work flow diagrams, audit diagram, value stream maps, TQM diagrams, ERD diagrams, EPC diagrams, marketing diagrams, cause and effect diagrams, dashboards, infographics and other relational business diagrams from your data.ConceptDraw PROJECT Software Overview
ConceptDraw PROJECT is an effective tool for new and experienced users with a fine balance of usability and powerful functionality.
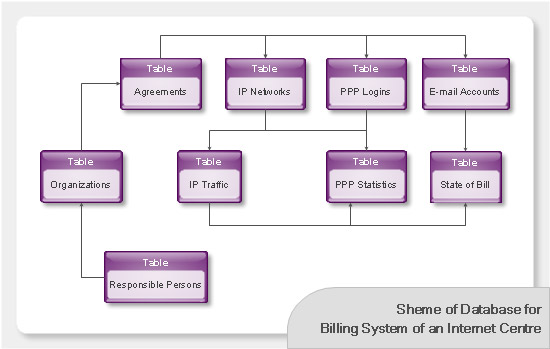
Databases Access Objects Model with ConceptDraw DIAGRAM
ConceptDraw Basic gives the opportunity of interaction with any ODBC-compatible databases. For this the Database Access Objects Model is provided. All calls to the database are made by certain methods of objects of this model.- Gantt Chart School Marketing
- How To Do Gantt Chart For Marketing In School
- Gantt Chart Sample School Project
- Gantt Chart For School Constructruction
- Gant Chart in Project Management | Gantt chart examples | What is ...
- Bar Graphs | Examples of Flowcharts, Org Charts and More ...
- Gant Chart in Project Management | Types of Flowcharts | ERD ...
- Sales Process Gantt Chart
- Marketing Plan Infographic | Gantt chart examples | Types of ...
- Gantt Chart Software | Seating Chart Template | Project — Assigning ...
- Gant Chart in Project Management | | What is Gantt Chart (historical ...
- Construction Project Chart Examples | What is Gantt Chart (historical ...
- How to Report Task's Execution with Gantt Chart | Gantt charts for ...
- Project Timeline | Gant Chart in Project Management | Timeline ...
- Gant Chart in Project Management | How to Draw a Gantt Chart ...
- Chart Examples | Event-driven Process Chain Diagrams | How to ...
- Simple School Line Plan
- School Meeting Erd Diagram
- Gantt Chart Software | Organizational Structure | Tree Network ...
- How to Create Presentation of Your Project Gantt Chart | Activity ...
- ERD | Entity Relationship Diagrams, ERD Software for Mac and Win
- Flowchart | Basic Flowchart Symbols and Meaning
- Flowchart | Flowchart Design - Symbols, Shapes, Stencils and Icons
- Flowchart | Flow Chart Symbols
- Electrical | Electrical Drawing - Wiring and Circuits Schematics
- Flowchart | Common Flowchart Symbols