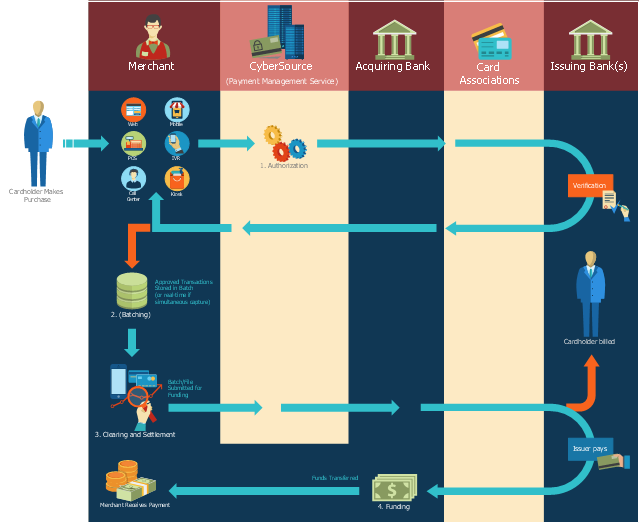
This payment process flowchart example was created on the base of the diagram of payment process using Global Payment Processing Services from the U.S. Securities and Exchange Commission website.
"Global Payment Processing Services. CyberSource Advanced enables merchants to accept payments made by all major credit and debit cards including American Express®, Discover®, Diners Club International®, JCB, MasterCard®, and Visa® cards. Our customers can also accept payment by corporate procurement cards, electronic checks, PayPal® Express Checkout, and the Bill Me Later® service. Merchants that have business models based on subscriptions can utilize the CyberSource recurring billing service with automated account updating services. For merchants selling internationally, we support direct debit, and bank transfers, as well as regional card brands such as Carte Bleue, Carta Si, Dankort, Laser, Solo, and Visa Electron. We provide these services for online, call center, kiosk, integrated voice response (“IVR”), and IP-enabled point of sale (“POS”) transactions."
[www.sec.gov/ Archives/ edgar/ data/ 934280/ 000119312510042764/ d10k.htm]
The flowchart example "Global Payment Solutions" was created using the ConceptDraw PRO diagramming and vector drawing software extended with the Sales Flowcharts solution from the Marketing area of ConceptDraw Solution Park.
Payment process flowchart
Cisco Products Additional. Cisco icons, shapes, stencils and symbols

Data Flow Diagrams

Work Flow Process Chart

 Cross-Functional Flowcharts
The Cross-Functional Flowcharts solution extends ConceptDraw DIAGRAM software with cross functional flowchart examples, samples, and libraries of cross functional flow chart vector design elements and CH-1 symbols for easy drawing professional-looking and illustrative Cross Functional Flowchart, Cross Functional Diagram, CH-1 Diagram, Process Flowchart, Deployment Flowchart, Opportunity Flowchart, Swimlane Process Mapping Diagram, or Visio Cross Functional Flowchart for planning and further analyzing, optimizing and improvement processes. The use of included pre-made cross functional flowchart template, opportunity flowchart template, and swimlane process map template, greatly easier designing your Cross-functional flowcharts.
Cisco Network Objects in ConceptDraw DIAGRAM

Identifying Quality Management System

Cross-functional flowchart landscape, U.S. units

Work Flow Diagram

Account Flowchart Stockbridge SystemFlowchart Examples
 Create your own flow charts of data processing systems using the ConceptDraw DIAGRAM diagramming and vector drawing software extended with the Cross-Functional Flowcharts solution from the Business Processes area of ConceptDraw Solution Park.
This is a flowchart of a data processing system combining manual and computerized processing to handle accounts receivable, billing, and general ledger.
Create your own flow charts of data processing systems using the ConceptDraw DIAGRAM diagramming and vector drawing software extended with the Cross-Functional Flowcharts solution from the Business Processes area of ConceptDraw Solution Park.
This is a flowchart of a data processing system combining manual and computerized processing to handle accounts receivable, billing, and general ledger.
Material Requisition Flowchart. Flowchart Examples
 Material requisition is a request generated by internal or external organization with a goal to inform the purchase department about the needed items and materials. The requisition can be represented as a written document on a pre-printed form or online request in form of electronic document. The electronic inquisition occupies a leading position in a modern world, now the paper forms are replaced by electronic ordering processes and workflows. The requisition is actively used in business as an internal document for notification the store about the needed goods, in medicine for making the orders on medical equipment and medicaments, in industry for creation request for purchasing some items and materials, and so on.
ConceptDraw DIAGRAM ector graphics software extended with Flowcharts solution from the Diagrams area is powerful and useful tool for drawing various types of Flowcharts, including without doubt the Material Requisition Flowchart of any degree of detailing. Succeed in drawing using the large quantity of predesigned flowchart specific shapes, symbols and icons.
Material requisition is a request generated by internal or external organization with a goal to inform the purchase department about the needed items and materials. The requisition can be represented as a written document on a pre-printed form or online request in form of electronic document. The electronic inquisition occupies a leading position in a modern world, now the paper forms are replaced by electronic ordering processes and workflows. The requisition is actively used in business as an internal document for notification the store about the needed goods, in medicine for making the orders on medical equipment and medicaments, in industry for creation request for purchasing some items and materials, and so on.
ConceptDraw DIAGRAM ector graphics software extended with Flowcharts solution from the Diagrams area is powerful and useful tool for drawing various types of Flowcharts, including without doubt the Material Requisition Flowchart of any degree of detailing. Succeed in drawing using the large quantity of predesigned flowchart specific shapes, symbols and icons.
ConceptDraw DIAGRAM
 ConceptDraw DIAGRAM is a powerful business and technical diagramming software tool that enables you to design professional-looking graphics, diagrams, flowcharts, floor plans and much more in just minutes. Maintain business processes performance with clear visual documentation. Effectively present and communicate information in a clear and concise manner with ConceptDraw DIAGRAM.
How to Create Flowcharts for anAccounting Information System
 Accounting information is a system of interrelated processes which represent financial and accounting data, required for decision making. For representing the accounting processes in a visual and easy for perception form are constructed Accounting Flowcharts. For their creation are used special flowchart symbols, this makes Accounting flowcharts understandable for all users of accounting information system and helps them easy understand the sequence of steps involved to accounting processes.
But how to create Flowcharts for an Accounting Information System fast and easy? Use of special design software is useful for this. ConceptDraw DIAGRAM software extended with Accounting Flowcharts solution is the best for creation accurate Accounting Flowcharts, for documentation and visually communication on how accounting processes work, how each operation is done. Accounting Flowcharts solution is supplied with library of predesigned commonly used vector symbols, Accounting Flowchart templates and samples demonstrating receiving, purchasing, payment, and other accounting processes.
Accounting information is a system of interrelated processes which represent financial and accounting data, required for decision making. For representing the accounting processes in a visual and easy for perception form are constructed Accounting Flowcharts. For their creation are used special flowchart symbols, this makes Accounting flowcharts understandable for all users of accounting information system and helps them easy understand the sequence of steps involved to accounting processes.
But how to create Flowcharts for an Accounting Information System fast and easy? Use of special design software is useful for this. ConceptDraw DIAGRAM software extended with Accounting Flowcharts solution is the best for creation accurate Accounting Flowcharts, for documentation and visually communication on how accounting processes work, how each operation is done. Accounting Flowcharts solution is supplied with library of predesigned commonly used vector symbols, Accounting Flowchart templates and samples demonstrating receiving, purchasing, payment, and other accounting processes.
Cross Functional Flowchart for Business Process Mapping
 Start your business process mapping with conceptDraw DIAGRAM and its Arrows10 Technology. Creating a process map, also called a flowchart, is a major component of Six Sigma process management and improvement. Use Cross-Functional Flowchart drawing software for business process mapping (BPM).
Use a variety of drawing tools, smart connectors and shape libraries to create flowcharts of complex processes, procedures and information exchange. Define and document basic work and data flows, financial, production and quality management processes to increase efficiency of you business.
Start your business process mapping with conceptDraw DIAGRAM and its Arrows10 Technology. Creating a process map, also called a flowchart, is a major component of Six Sigma process management and improvement. Use Cross-Functional Flowchart drawing software for business process mapping (BPM).
Use a variety of drawing tools, smart connectors and shape libraries to create flowcharts of complex processes, procedures and information exchange. Define and document basic work and data flows, financial, production and quality management processes to increase efficiency of you business.
TQM Diagram Example
 The Total Quality Management Diagram solution helps you and your organization visualize business and industrial processes. Create Total Quality Management diagrams for business process with ConceptDraw software.
Windows Azure
 The Microsoft Windows Azure platform is a highly flexible cloud-based solution with variety of services which supports not only the execution of.NET applications, but also allows developers to use programming languages like Java, PHP, Node.js, or Python.
ConceptDraw DIAGRAM diagramming and vector drawing software provides the Azure Architecture Solution from the Computer and Networks area of ConceptDraw Solution Park with a lot of useful tools which make easier: illustration of Windows Azure possibilities and features, describing Windows Azure Architecture, drawing Azure Architecture Diagrams, depicting Azure Cloud System Architecture, describing Azure management, Azure storage, documenting Azure services.
The Microsoft Windows Azure platform is a highly flexible cloud-based solution with variety of services which supports not only the execution of.NET applications, but also allows developers to use programming languages like Java, PHP, Node.js, or Python.
ConceptDraw DIAGRAM diagramming and vector drawing software provides the Azure Architecture Solution from the Computer and Networks area of ConceptDraw Solution Park with a lot of useful tools which make easier: illustration of Windows Azure possibilities and features, describing Windows Azure Architecture, drawing Azure Architecture Diagrams, depicting Azure Cloud System Architecture, describing Azure management, Azure storage, documenting Azure services.
UML Flowchart Symbols
 The UML diagram is a powerful tool which lets visually represent all system's components, the interactions between them and relationships with external user interface.
The Rapid UML solution for ConceptDraw DIAGRAM software offers diversity of UML flowchart symbols for drawing all types of UML diagrams.
The UML diagram is a powerful tool which lets visually represent all system's components, the interactions between them and relationships with external user interface.
The Rapid UML solution for ConceptDraw DIAGRAM software offers diversity of UML flowchart symbols for drawing all types of UML diagrams.
Workflow Diagram Software Mac
 ConceptDraw DIAGRAM software is the best Mac software for drawing workflow diagrams. Its rich set of samples and templates, and specific features to draw diagrams faster make this software as comfortable as possible for drawing workflow diagrams.
Use the ConceptDraw DIAGRAM professional Mac OS X software for drawing workflow diagram. The Workflow Diagrams solution with its libraries and templates set make the possibility to identify resources that are required for work goal implementation. The process flow diagram identify flow which occurs as network of process dependencies, organizational decisions and interactions between departments. Usually workflow diagrams show business participants actions that carry product or service to the final destination, the consumer.
ConceptDraw DIAGRAM software is the best Mac software for drawing workflow diagrams. Its rich set of samples and templates, and specific features to draw diagrams faster make this software as comfortable as possible for drawing workflow diagrams.
Use the ConceptDraw DIAGRAM professional Mac OS X software for drawing workflow diagram. The Workflow Diagrams solution with its libraries and templates set make the possibility to identify resources that are required for work goal implementation. The process flow diagram identify flow which occurs as network of process dependencies, organizational decisions and interactions between departments. Usually workflow diagrams show business participants actions that carry product or service to the final destination, the consumer.
IVR Systems
 ConceptDraw DIAGRAM extended with Interactive Voice Response Diagrams Solution from the Computer and Networks Area enables to make quick and effective drawing the IVR diagrams describing the IVR systems of any complexity quick and effective.
Example of DFD for Online Store (Data Flow Diagram)
 Data Flow Diagram (DFD) is a methodology of graphical structural analysis and information systems design, which describes the sources external in respect to the system, recipients of data, logical functions, data flows and data stores that are accessed. DFDs allow to identify relationships between various system's components and are effectively used in business analysis and information systems analysis. They are useful for system’s high-level details modeling, to show how the input data are transformed to output results via the sequence of functional transformations. For description of DFD diagrams are uses two notations — Yourdon and Gane-Sarson, which differ in syntax.
Online Store DFD example illustrates the Data Flow Diagram for online store, the interactions between Customers, Visitors, Sellers, depicts User databases and the flows of Website Information. ConceptDraw DIAGRAM enhanced with Data Flow Diagrams solution lets you to draw clear and simple example of DFD for Online Store using special libraries of predesigned DFD symbols.
Data Flow Diagram (DFD) is a methodology of graphical structural analysis and information systems design, which describes the sources external in respect to the system, recipients of data, logical functions, data flows and data stores that are accessed. DFDs allow to identify relationships between various system's components and are effectively used in business analysis and information systems analysis. They are useful for system’s high-level details modeling, to show how the input data are transformed to output results via the sequence of functional transformations. For description of DFD diagrams are uses two notations — Yourdon and Gane-Sarson, which differ in syntax.
Online Store DFD example illustrates the Data Flow Diagram for online store, the interactions between Customers, Visitors, Sellers, depicts User databases and the flows of Website Information. ConceptDraw DIAGRAM enhanced with Data Flow Diagrams solution lets you to draw clear and simple example of DFD for Online Store using special libraries of predesigned DFD symbols.
 Steps to Creating a Sales Process Flow Chart
Flowchart Examples
Create your own flow charts of data processing systems using the ConceptDraw DIAGRAM diagramming and vector drawing software extended with the Cross-Functional Flowcharts solution from the Business Processes area of ConceptDraw Solution Park.
This is a flowchart of a data processing system combining manual and computerized processing to handle accounts receivable, billing, and general ledger.
Material Requisition Flowchart. Flowchart Examples
ConceptDraw DIAGRAM
How to Create Flowcharts for anAccounting Information System
Cross Functional Flowchart for Business Process Mapping
TQM Diagram Example
Windows Azure
UML Flowchart Symbols
Workflow Diagram Software Mac
IVR Systems
Example of DFD for Online Store (Data Flow Diagram)
- Process Flowchart | Amazon Web Services | Competing consumers ...
- Global Payment Solutions | Design elements - Sales flowchart ...
- ConceptDraw Arrows10 Technology | Flowchart Service Center
- Global Payment Solutions | Pos System Flowchart
- Invoice payment process - Flowchart | Global Payment Solutions ...
- Global Payment Solutions | Sales Flowcharts | Sales flowchart ...
- Invoice payment process - Flowchart | Accounting Flowchart ...
- Global Payment Solutions | Flowcharts | Sales Steps | Cybersource ...
- Business Process Flowchart Symbols | Process Flow Chart Symbol ...
- Interactive Voice Response Diagrams | Network Diagram Software ...