Made with
ConceptDraw
DIAGRAM 17

IVR Systems

“Interactive voice response (IVR) is a technology that allows a computer to interact with humans through the use of voice and DTMF tones input via keypad.

IVR systems are typically intended to service high call volumes, reduce cost and improve the customer experience. Examples of typical IVR applications are telephone banking, televoting, and credit card services. Companies also use IVR services to extend their business hours to 24/7 operation.

Call centers use IVR systems to identify and segment callers. The ability to identify customers allows services to be tailored according to the customer profile. IVR also enables customer prioritization.”[from Wikipedia]

ConceptDraw DIAGRAM extended with Interactive Voice Response Diagrams Solution from the Computer and Networks Area enables to make quick and effective drawing the IVR diagrams describing the IVR systems of any complexity.

IVR Systems *

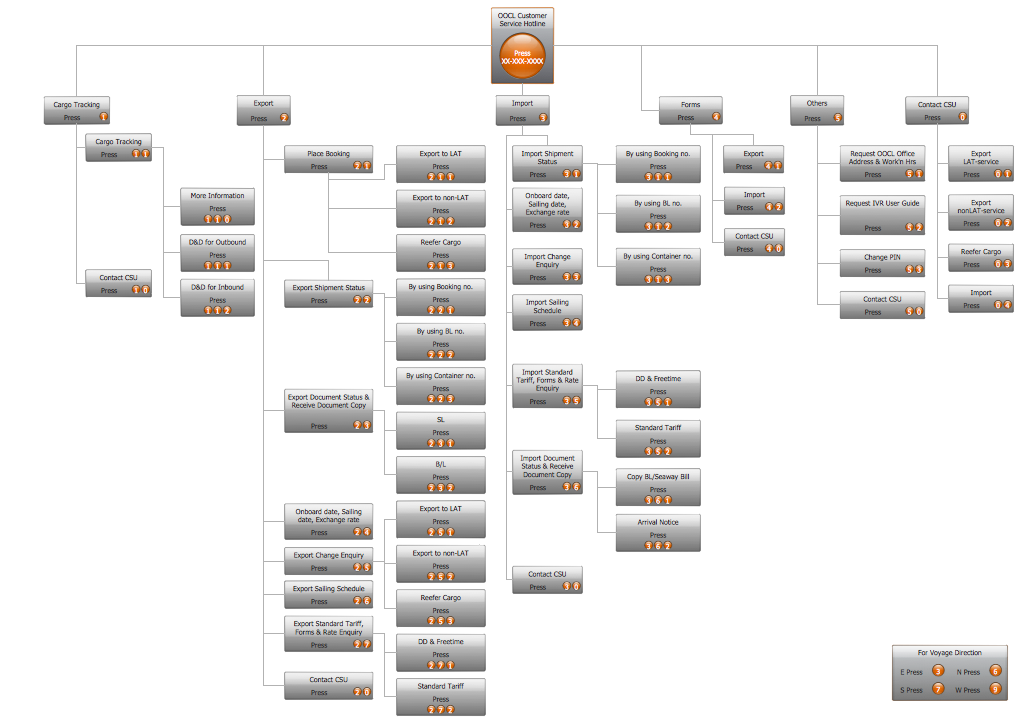
Example 1. IVR Systems - IVR Customer Service Hotline Diagram

How many examples and samples of IVR systems are included in the Interactive Voice Response Diagrams Solution! They are so various, professional looking, neatly made and attractive. Choosing the desired of them you can change it in seconds and then successfully use in your work activity.

Interactive Voice Response Diagrams Solution in ConceptDraw STORE

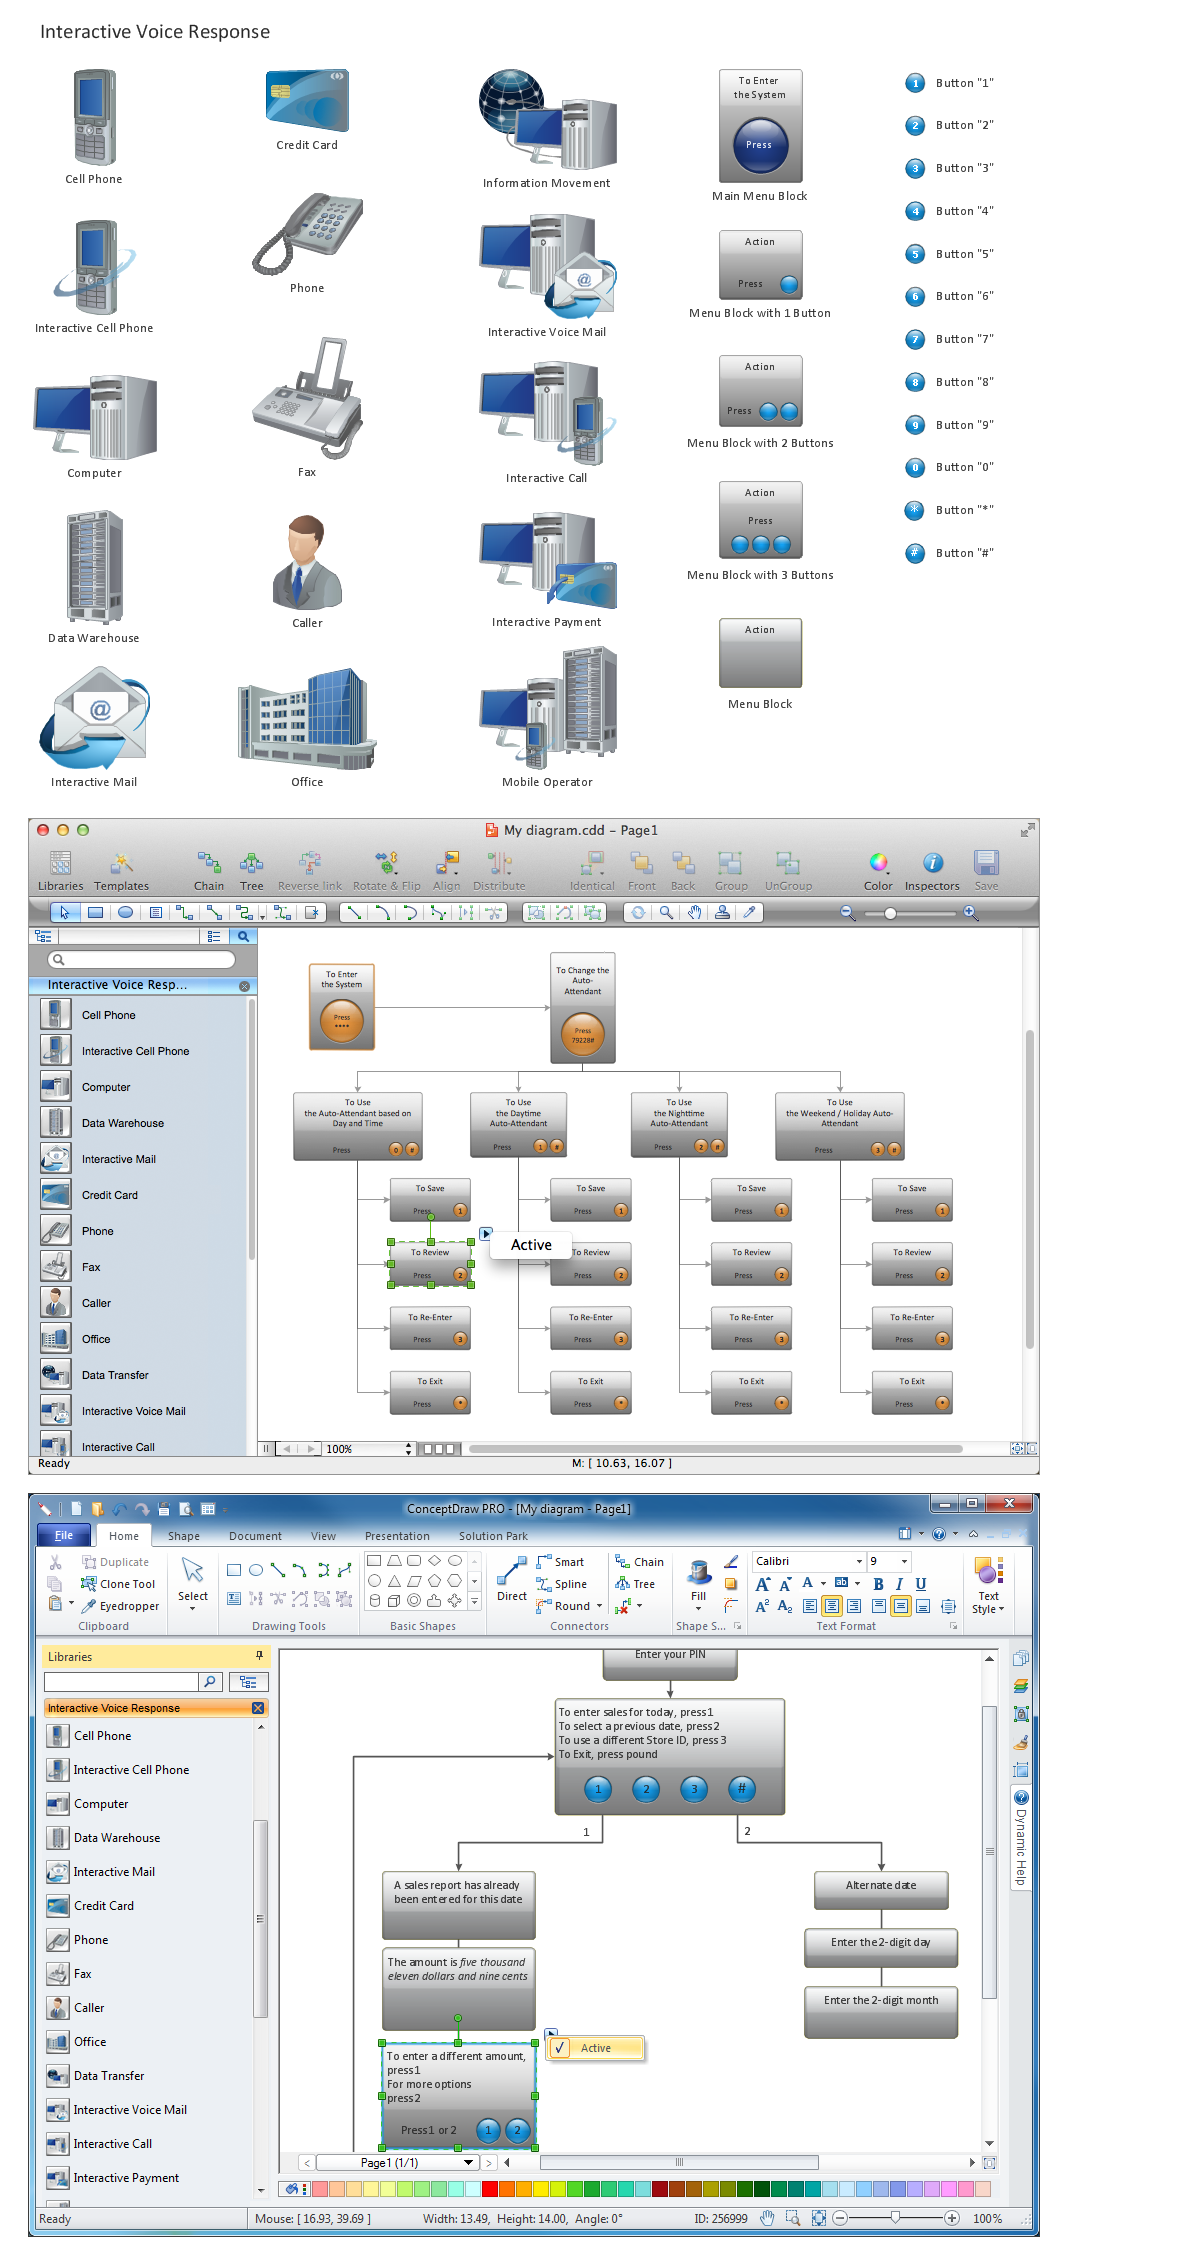
Example 2. Interactive Voice Response Diagrams Solution in ConceptDraw STORE

It was also developed the Interactive Voice Response library with 35 ready-to-use vector objects to help you in IVR systems diagrams drawing. Use actively them and many other objects from the numerous libraries of ConceptDraw Solution Park.

IVR Balance Recharge Diagram

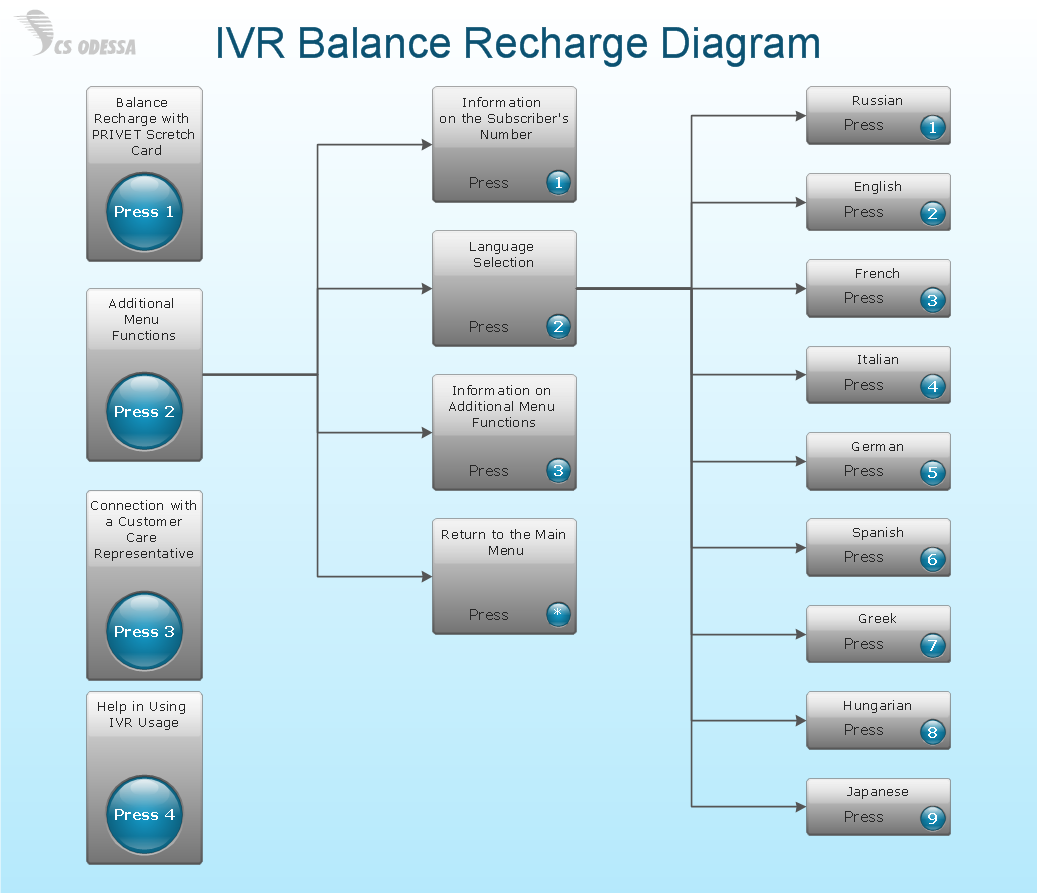
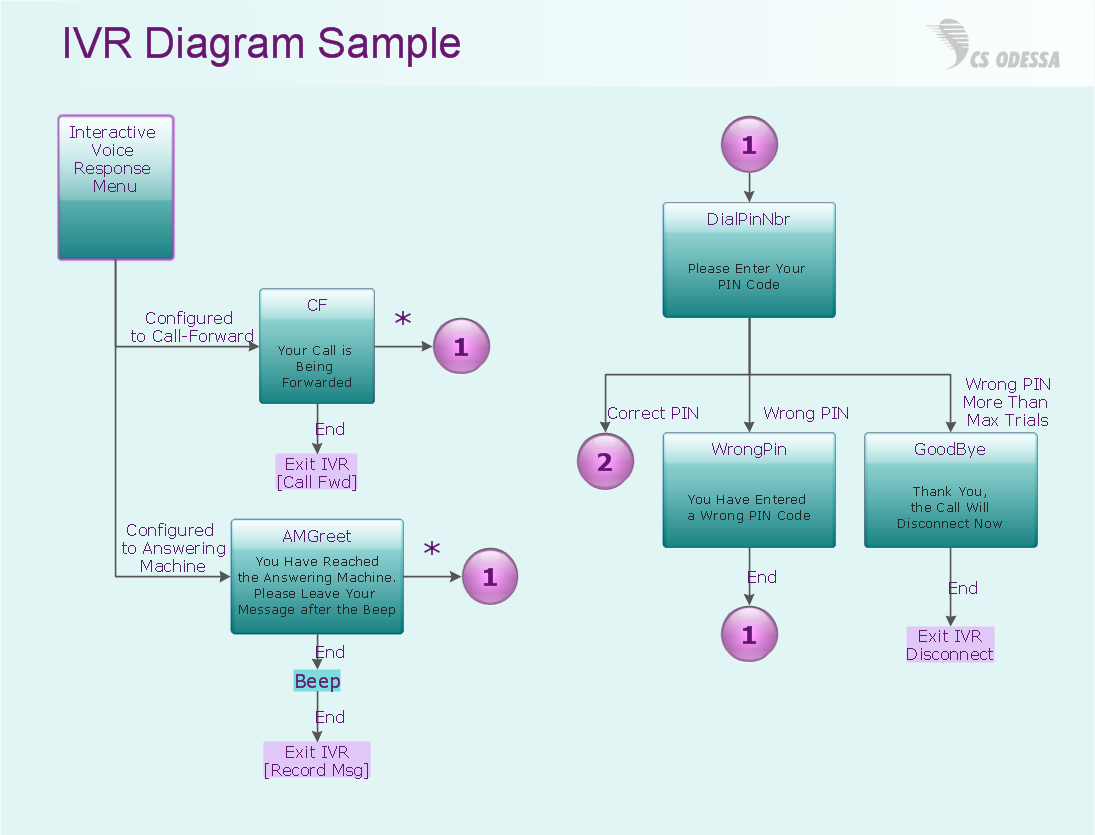
Example 3. IVR Systems - IVR Balance Recharge Diagram

The samples you see on this page were created in ConceptDraw DIAGRAM using the tools of Interactive Voice Response Diagrams Solution. They are the good examples of IVR Systems diagrams, and also successfully demonstrate solution's capabilities. An experienced user spent 10 minutes creating every of these samples.

All source documents are vector graphic documents. They are available for reviewing, modifying, or converting to a variety of formats (PDF file, MS PowerPoint, MS Visio, and many other graphic formats) from the ConceptDraw STORE. The Interactive Voice Response Diagrams Solution is available for all ConceptDraw DIAGRAM or later users.


FOUR RELATED HOW TO's:
A Point-to-multipoint (P2MP) communication is a communication that is accomplished through the one-to-many connection. This example was created in ConceptDraw DIAGRAM using the Computer and Networks Area of ConceptDraw Solution Park and shows the Point-to-multipoint (P2MP) network.Point-to-multipoint  (P2MP) Network. <br>Computer and Network Examples *
Picture: Point-to-multipoint (P2MP) Network. Computer and Network Examples
Related Solution:
Organizing and Selecting Social Media Response Messages. Interactive Flowcharts can change the way one creates and organizes their social media response process.What is Interactive Flowcharts *
Picture: What is Interactive Flowcharts
Related Solution:
To your mind, deliberation about the profits of creating organizational charts takes more time than actually creating itself. If lack of software is the only thing that stops you, you should know that organizational charts with ConceptDraw DIAGRAM are created within a few minutes. Owing to the great number of ready-to-use templates, you’ll get your chart easily. Chart is a very handy format for visually depicting official relations of an organization. Usually, an Orgchart (organizational chart) consists from simple geometrical shapes, containing an information on a position, personal data, and the lines that means responsibilities and accountabilities associated with position. ConceptDraw solution designed for making organizational charts enables one to create various org charts effortlessly using special templates and vector libraries.Organizational Charts with ConceptDraw DIAGRAM  *
Picture: Organizational Charts with ConceptDraw DIAGRAM
Related Solution:
How to draw Metro Map style infographics of New York subway. New York Subway has a long history starting on October 27, 1904. Since the opening many agencies have provided schemes of the subway system. At present time are 34 lines in use. This page present New York City subway map construct with Metro Map Solution in Conceptdraw DIAGRAM software. This is a one-click tool to add stations to the map. It lets you control the direction in which you create new stations, change lengths, and add text labels and icons. It contains Lines, Stations, and Landmarks objectsHow to draw Metro Map style infographics?   <i>(New York)</i> *
Picture: How to draw Metro Map style infographics? (New York)
Related Solution:
ConceptDraw
DIAGRAM 17