, t chart, decision matrix, decision tree analysis") Decision Making
Decision Making
The Decision Making solution offers the set of professionally developed examples, powerful drawing tools and a wide range of libraries with specific ready-made vector decision icons, decision pictograms, decision flowchart elements, decision tree icons, decision signs arrows, and callouts, allowing the decision maker (even without drawing and design skills) to easily construct Decision diagrams, Business decision maps, Decision flowcharts, Decision trees, Decision matrix, T Chart, Influence diagrams, which are powerful in questions of decision making, holding decision tree analysis and Analytic Hierarchy Process (AHP), visual decomposition the decision problem into hierarchy of easily comprehensible sub-problems and solving them without any efforts.
Ansoff Matrix

Understanding the Audit Process: A Comprehensive Guide. Audit Process Flowchart

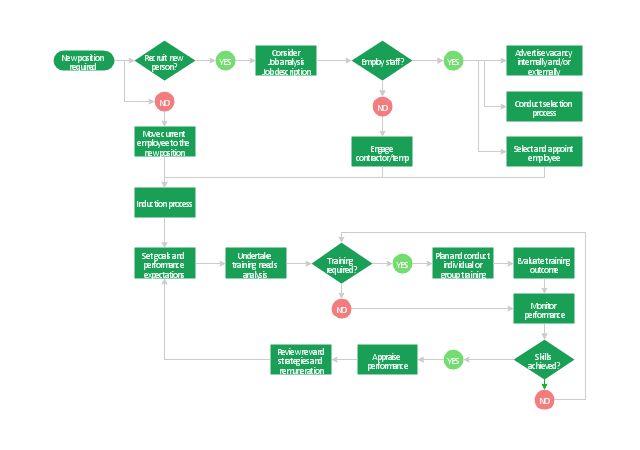
"Human resource management (HRM, or simply HR) is the management process of an organization's workforce, or human resources. It is responsible for the attraction, selection, training, assessment, and rewarding of employees, while also overseeing organizational leadership and culture and ensuring compliance with employment and labor laws. In circumstances where employees desire and are legally authorized to hold a collective bargaining agreement, HR will also serve as the company's primary liaison with the employees' representatives (usually a trades union).
HR is a product of the human relations movement of the early 20th century, when researchers began documenting ways of creating business value through the strategic management of the workforce. The function was initially dominated by transactional work, such as payroll and benefits administration, but due to globalization, company consolidation, technological advancement, and further research, HR now focuses on strategic initiatives like mergers and acquisitions, talent management, succession planning, industrial and labor relations, and diversity and inclusion." [Human resource management. Wikipedia]
The flow chart example "HR management process" was created using the ConceptDraw PRO diagramming and vector drawing software extended with the Flowcharts solution from the area "What is a Diagram" of ConceptDraw Solution Park.
Flowchart - HR management process
SWOT Analysis Solution - Strategy Tools

Decision Making


Business Productivity - Management

Manage Social Media Response Plan DFD

The vector stencils library "Management pictograms" contains 72 management pictograms.
Use it to create your management infogram in the ConceptDraw PRO diagramming and vector drawing software.
The flat icons example "Management pictograms - Vector stencils library" is included in the solution "Marketing infographics" from the "Business infographics" area of ConceptDraw Solution Park.
Use it to create your management infogram in the ConceptDraw PRO diagramming and vector drawing software.
The flat icons example "Management pictograms - Vector stencils library" is included in the solution "Marketing infographics" from the "Business infographics" area of ConceptDraw Solution Park.
Accounting management

Activity

Audit management

Board of directors

Budget

Business managemen

Business management tools

Business model

Commanding

Communication

Company

Contract management

Controlling

Coordinating

Core competencies

Corporate strategy

Creativity

Crisis management

Crisis management 2

Decision making

Environmental management

Expenses

External environment

Financial management

Financial management 2

Financial planning

First-level manager

Goal

HR management

Investment management

IT management

Knowledge management

Knowledge management 2

Leadership

Macro environment

Management system

Managerial accounting

Manufacturing management

Market orientation

Marketing management

Marketing strategy

Middle-level manager

Mission

Objectives

Operations management

Organizing

Performance

Performance management

Planning

Policy

PR management

Problem solving

Process management

Product management

Profit

Profit 2

Project management

Quality management

Research and development

Resource management

Resources

Risk management

Sales manegment

Service management

Stakeholder management

Strategic management

Strategic planning

Technology management

Time frame

Time management

Top-level manager

Vision

What is SWOT Analysis in Marketing

Competitor Analysis

BCG Matrix

The vector stencils library "Management pictograms" contains 72 management pictograms.
Use it to create your management infogram in the ConceptDraw PRO diagramming and vector drawing software.
The flat icons example "Management pictograms - Vector stencils library" is included in the solution "Marketing infographics" from the "Business infographics" area of ConceptDraw Solution Park.
Use it to create your management infogram in the ConceptDraw PRO diagramming and vector drawing software.
The flat icons example "Management pictograms - Vector stencils library" is included in the solution "Marketing infographics" from the "Business infographics" area of ConceptDraw Solution Park.
Accounting management
Activity
Audit management
Board of directors
Budget
Business managemen
Business management tools
Business model
Commanding
Communication
Company
Contract management
Controlling
Coordinating
Core competencies
Corporate strategy
Creativity
Crisis management
Crisis management 2
Decision making
Environmental management
Expenses
External environment
Financial management
Financial management 2
Financial planning
First-level manager
Goal
HR management
Investment management
IT management
Knowledge management
Knowledge management 2
Leadership
Macro environment
Management system
Managerial accounting
Manufacturing management
Market orientation
Marketing management
Marketing strategy
Middle-level manager
Mission
Objectives
Operations management
Organizing
Performance
Performance management
Planning
Policy
PR management
Problem solving
Process management
Product management
Profit
Profit 2
Project management
Quality management
Research and development
Resource management
Resources
Risk management
Sales manegment
Service management
Stakeholder management
Strategic management
Strategic planning
Technology management
Time frame
Time management
Top-level manager
Vision
Sales Process Flowchart Symbols

KPI Dashboard

 Business Processes Area
Solutions of Business Processes area extend ConceptDraw DIAGRAM software with samples, templates and vector stencils libraries for drawing business process diagrams and flowcharts for business process management.
Organizational Structure

 HR Flowcharts
The HR Flowcharts solution is ideal for using while creating the HR-related drawings in the ConceptDraw DIAGRAM charting and drawing software, providing with a comprehensive collection of human resources themed icons, connectors, and images from the available stencil libraries, helping illustrating flowcharts, infographics and workflow diagrams.
What is an Organizational Chart and how it works?Organization Chart Software

Organization Chart Software: A Comprehensive Guide


- How to Create a PowerPoint Presentation from a SWOT Matrix | How ...
- Cross Functional Flowchart Shapes | Diagram Strategic Decision ...
- Marketing Diagrams | Block Diagrams | Management | A Diagram Of ...
- Management | With A Diagram Discuss Strategic Decision Making
- Total Quality Management Value - Strategy Tools
- Total Quality Management Value | Process Flowchart | Marketing ...
- ConceptDraw Arrows10 Technology | ConceptDraw Solution Park ...
- HR management process - Flowchart | Sales Process Flowchart ...
- Risk management | Risk Management Strategies Examples
- Competitor Analysis | Strategic Management Diagrams